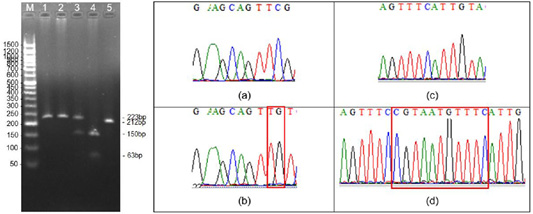
Figure 1:
The visualization of band patterns from gel electrophoresis shows the appearance of the A (3, 4), F (1, 2, 3), and N (5) alleles of the CSN1S1 gene, then M as DNA ladder (left). Snapshots of chromatograms on the interested section (right) showing the C deletion (a vs b) and 11bp insertion (c vs d).