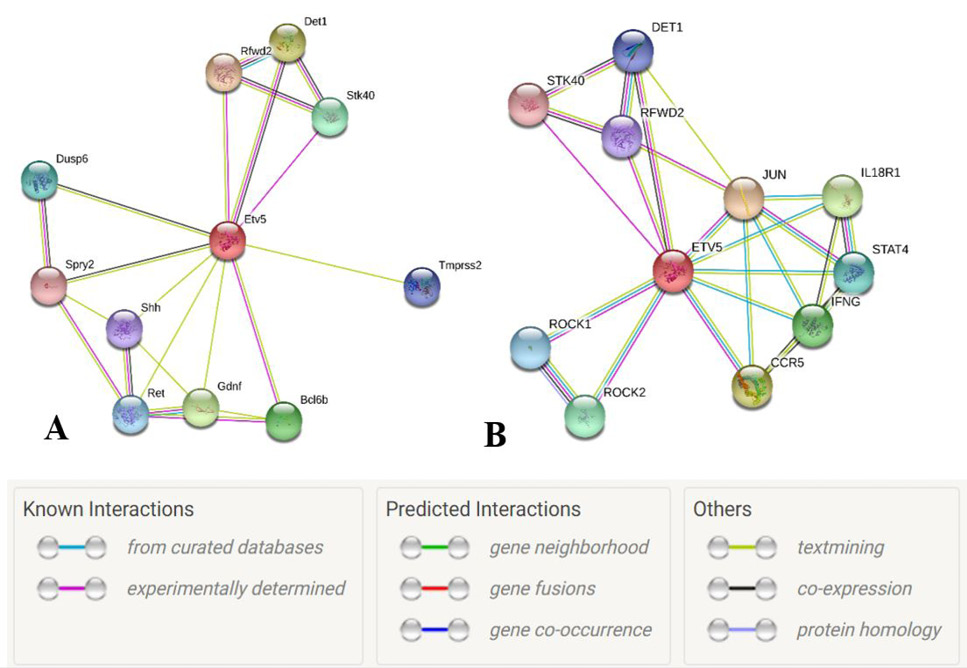
Fig. 4.
Node graph of the interacting partners of Etv5. A, Mus musculus and B, Homo sapiens, with proteins represented by network nodes. The node in red color is the query protein while other nodes are the proteins having first shell of interaction with the query protein (STRINGS, ETV5 Homo sapiens).