View larger version:
Download Original File
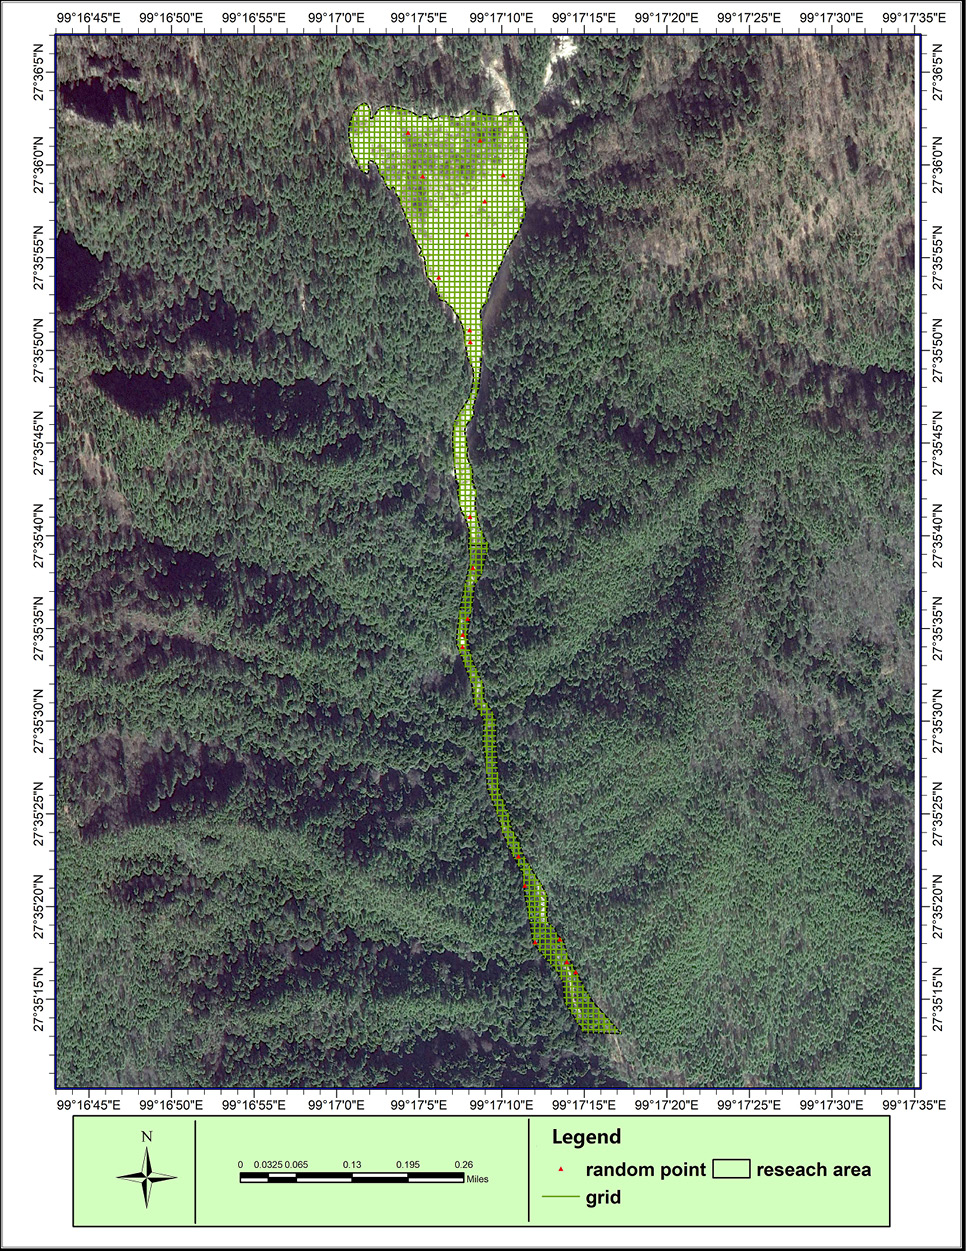
Fig. 1.
Diagram of the study area grid.
