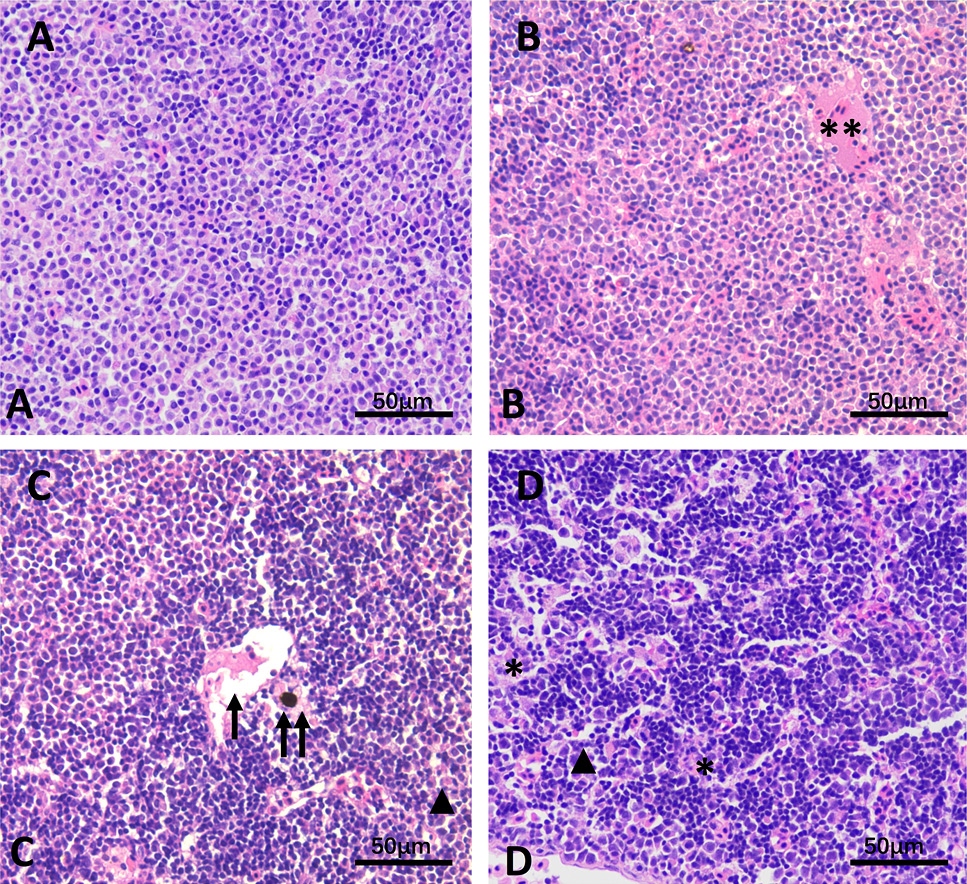
Fig. 2.
Transverse sections showing histopathology of head kidney(400X), A: Normal appearance (C group, 6 h); B: A small amount of MMCs appeared, tissue vacuoles and ambiguous cell boundaries were occasionally seen (T3 group, 6 h); C: Colloidal enlargement, tissue boundaries were occasionally seen (T2 group, 6h); D: ambiguous cell boundaries and massive necrotic cells (T1 group, 96 h). Note: ambiguous cell boundaries (▲), tissue vacuoles (↑), MMCs distribution (↑↑), necrotic cells (*), colloidal enlargement (**).