
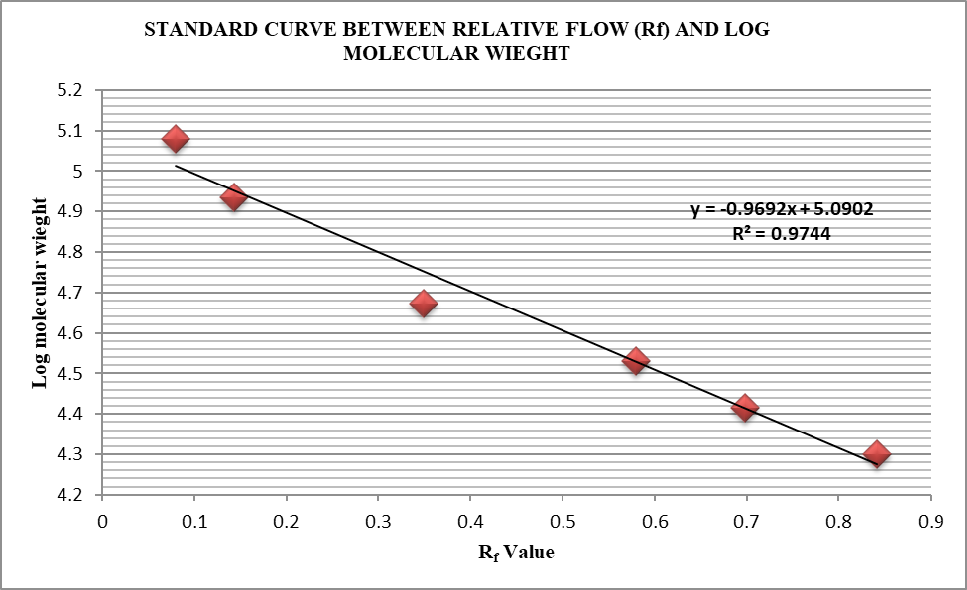
Fig. 4.
A standard Curve obtained by plotting a scatter graph between Rf values and log of known molecular weight of protein marker. The X-axis shows the Rf values ranging from 0 to 0.9. Y-axis shows the log of molecular weight ranging from 4.2 to 5.2. The regression formula (y = -0.9692x + 5.0902) obtained was used to calculate the molecular weight of all the unknown proteins separated on the gel. Where Y= Rf value of that specific protein band and X= Molecular weight of unknown protein band.