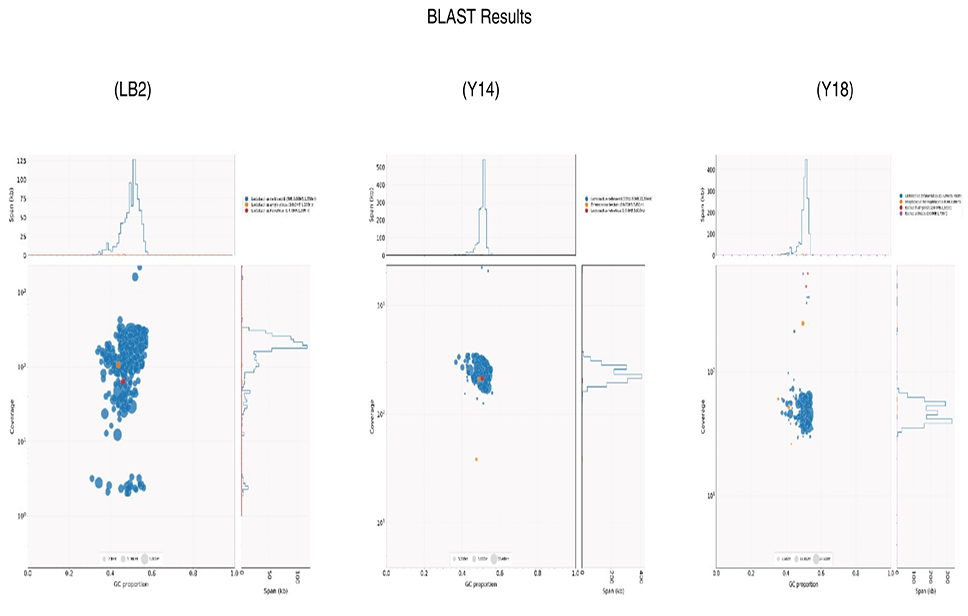
Fig. 1.
Blob plots indicate the results of BLAST matches of each of the three assembled genomes. The colors indicate BLAST matches to different species of bacteria. The proportion of GC contents in each assembled genome is also indicated.
Blob plots indicate the results of BLAST matches of each of the three assembled genomes. The colors indicate BLAST matches to different species of bacteria. The proportion of GC contents in each assembled genome is also indicated.