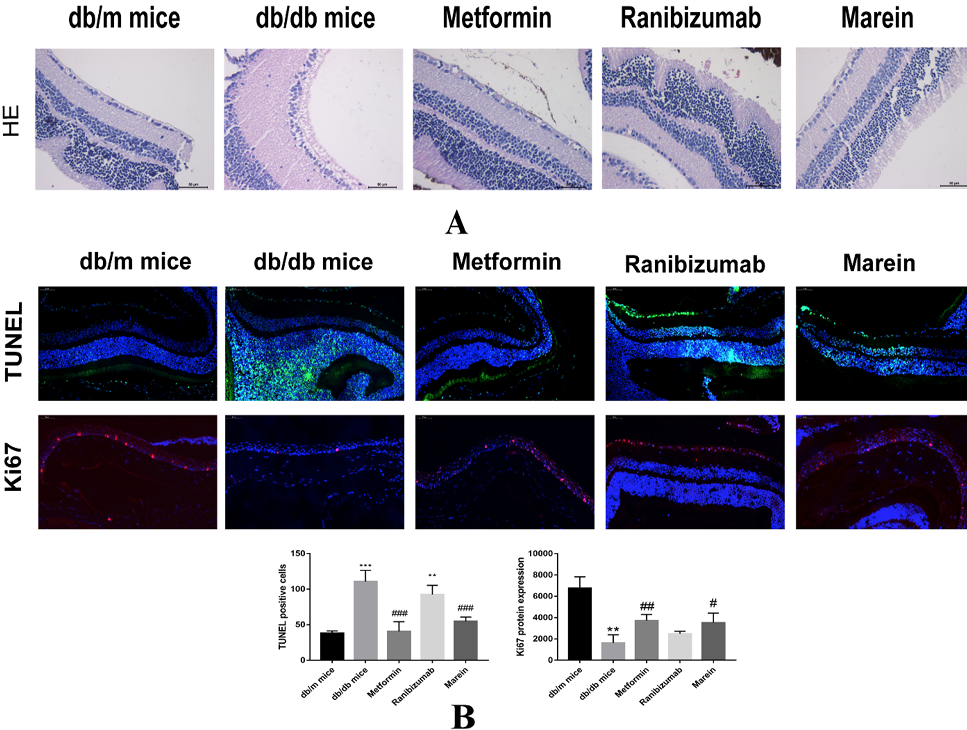
Fig. 2.
A: HE staining of retina tissue in experimental mice (400×); B: Effect of marein on proliferation and apoptosis of retinal tissue in db/db mice. Note: The values were expressed as `x ± SEM, n ≥ 6, *P < 0.05, **P < 0.01, ***P < 0.001 indicated statistical significance compared with the control group. #P < 0.05, ##P < 0.01, ###P < 0.001 indicated statistical significance compared with the model group.