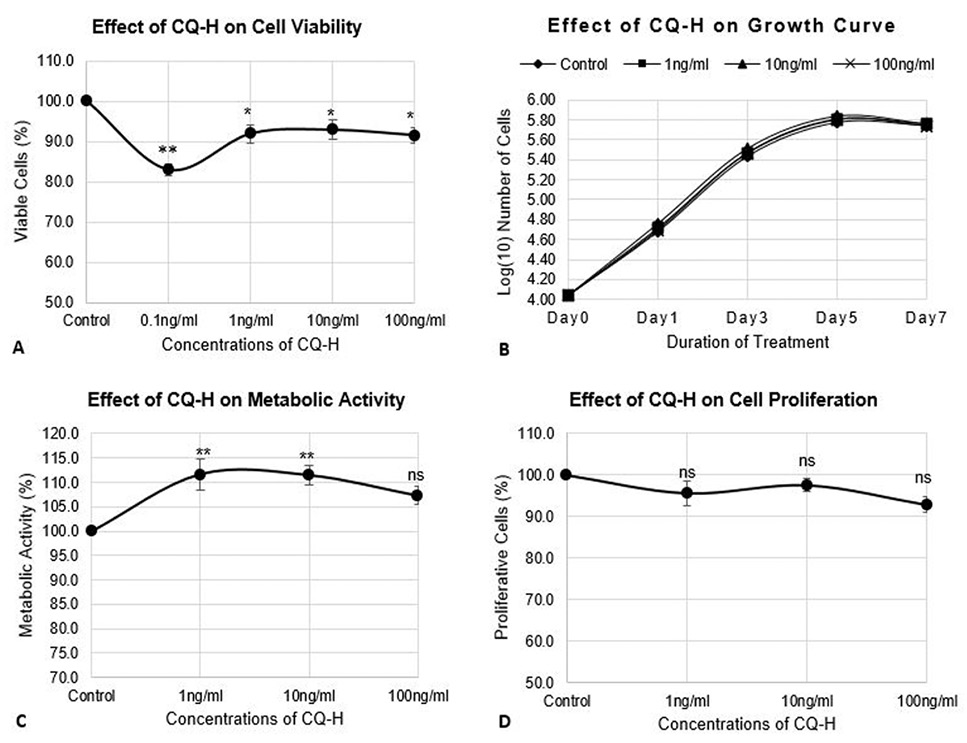
Effect of CQ-H on cell viability, growth parameters, and proliferation of RAW264.7 cell line. The cells were seeded at density of 3000 cells/cm2 in 24-well plates. The control cells were fed with 0.05% DMSO supplemented complete medium whereas, complete medium containing 1, 10, and 100 ng/ml CQ-H was fed to the treated cultures. (A) Neutral red assay was performed for analysis of cell viability. The cells were treated with CQ-H for 72h. Assay was performed at 24h and 72h. Averages of values were taken. (B) Growth curve was generated by treated cells with CQ-H for 7 days and counting them on alternate days (day 1, 3, 5, and 7). Logarithmic values of cell number were plotted to reveal lag, log, stationery and decline phase of cell growth. (C) MTT assay and (D) BrdU incorporation assay was performed to analyze effect of CQ-H on the metabolic activity and cell proliferation respectively. The cells were seeded for up to 72h and assays were performed at 24 and 72h. Averages of values were taken. Data are represented as Mean ± SD of technical and biological replicates for each experiment. For statistical analyses, ANOVA with Dunnett’s test for multiple comparison was performed using GraphPad Prism (v 7.03). (P≤0.05; ns = not significant, * P≤0.05, **P≤0.01, ***P≤0.001, ****P≤0.0001).
