
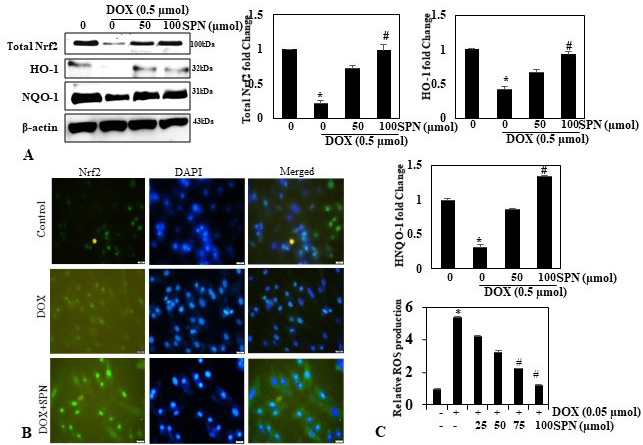
Fig. 4.
SPN on Nrf2 signaling. (A) WB showing expression of total Nrf2, HO-1 and NQO-1 control and treatment groups. (B) Effect of SPN on Nrf2 nuclear translocation. (C) ROS formation. P<0.05 significantly different from the control group.