
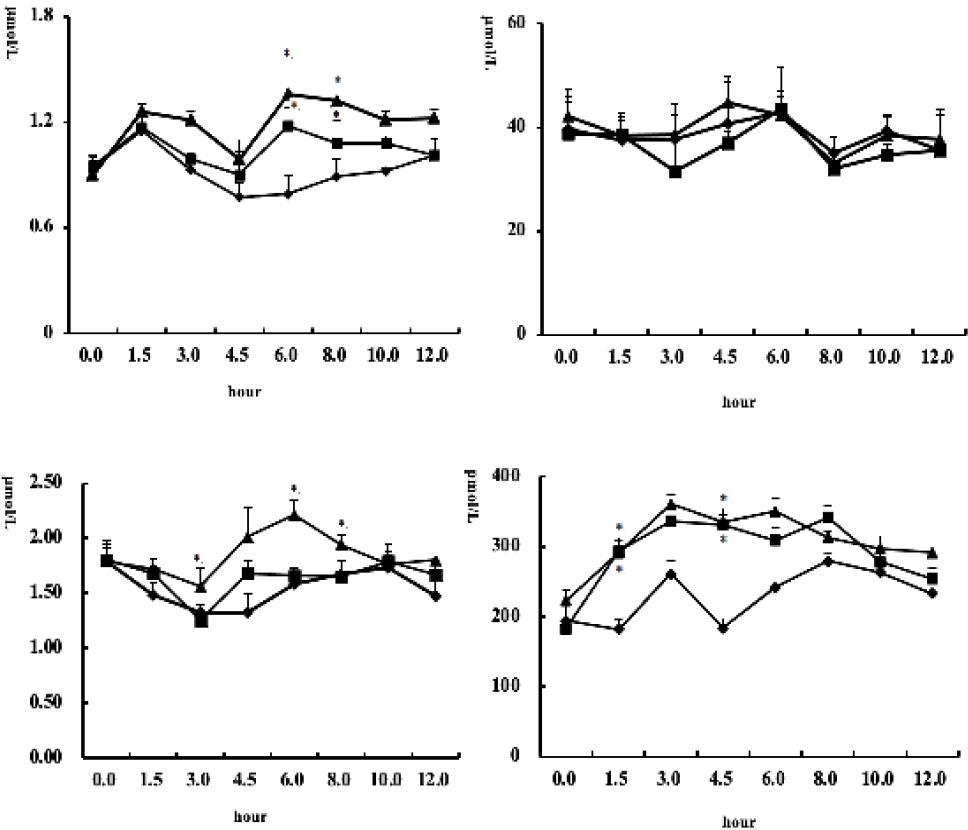
Fig. 1.
Plasma 5-hydroxytryptophan (A) tryptophan (B) 5-hydroxytryptamine (C) and melatonin (D) concentrations in the sheep provided diet supplemented with 55.5 mg/kg BW RPT 5-HTP or 111 mg/kg BW RPT 5-HTP at 07:30 h.
Control (♦-♦); CT+111(■-■); CT+222(▲-▲). The below abscissa shows the time after feeding. The data are presented as mean ± S.D. The means within a time point without common superscripts were significantly different (P < 0.05). *P < 0.05.