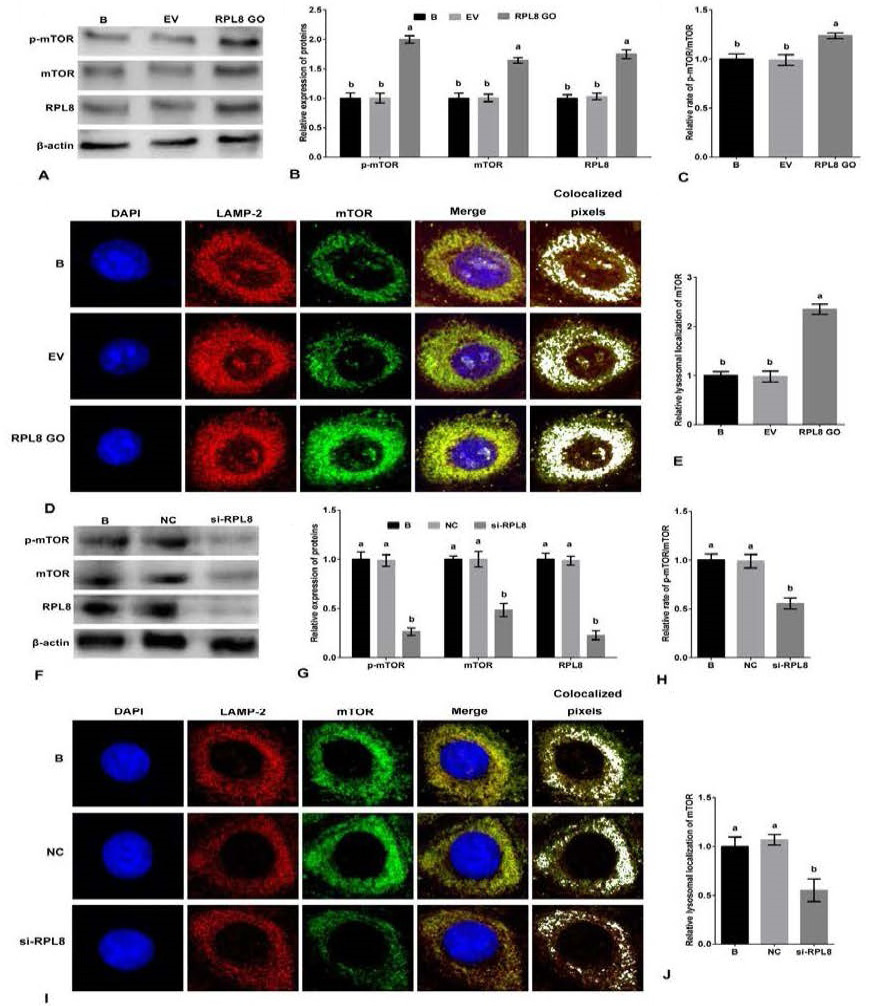
Activation of mTORC1 pathway by RPL8 in YMECs. A-B, the expression of mTOR and p-mTOR in YMECs treated with RPL8 overexpression. C, the rate of p-mTOR/mTOR in YMECs treated with RPL8 overexpression. D-E, the lysosomal localization of mTOR in YMECs treated with RPL8 overexpression. F-G, the expression of mTOR and p-mTOR in YMECs treated with RPL8 silencing. H, the rate of pmTOR/mTOR in YMECs treated with RPL8 silencing. I-J, the lysosomal localization of mTOR in YMECs treated with RPL8 silencing. In B and G, the expression of mTOR and p-mTOR in “B” group was set to “1”. In C and H, the rate of p-mTOR/mTOR in “B” group was set to “1”. In D and I, the colocalization between LAMP2 (green) and mTOR (red) was visualized and quantified using the ImageJ colocalization finder plugin (white). B: cells were no transfected. EV: cells were transfected with the empty vector. RPL8 GO: cells were transfected with RPL8 overexpression vector. NC: cells were transfected with the negative control siRNA. si-RPL8: cells were transfected with the RPL8 siRNA. In the bar charts, different superscript letters indicate significant differences (p<0.05), while the same letters represent no significant difference (p<0.05).