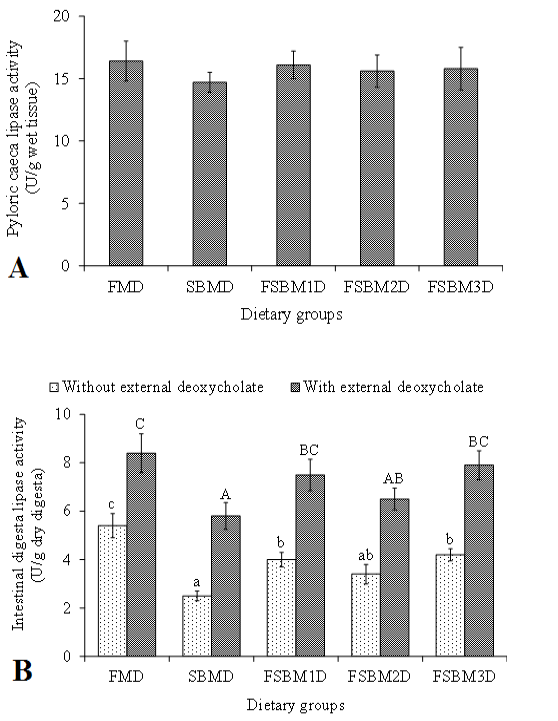
Fig. 2.
Lipase activity in the pyloric caeca and anterior ID of pompano fed the experimental diets. (A) Lipase activity in the pyloric caeca. (B) Lipase activity in the anterior ID. Values are presented as the mean ± standard deviation (pyloric caeca, n = 15; ID, n = 6). Bars with different superscripts within each analysis condition are significantly different (P < 0.05).