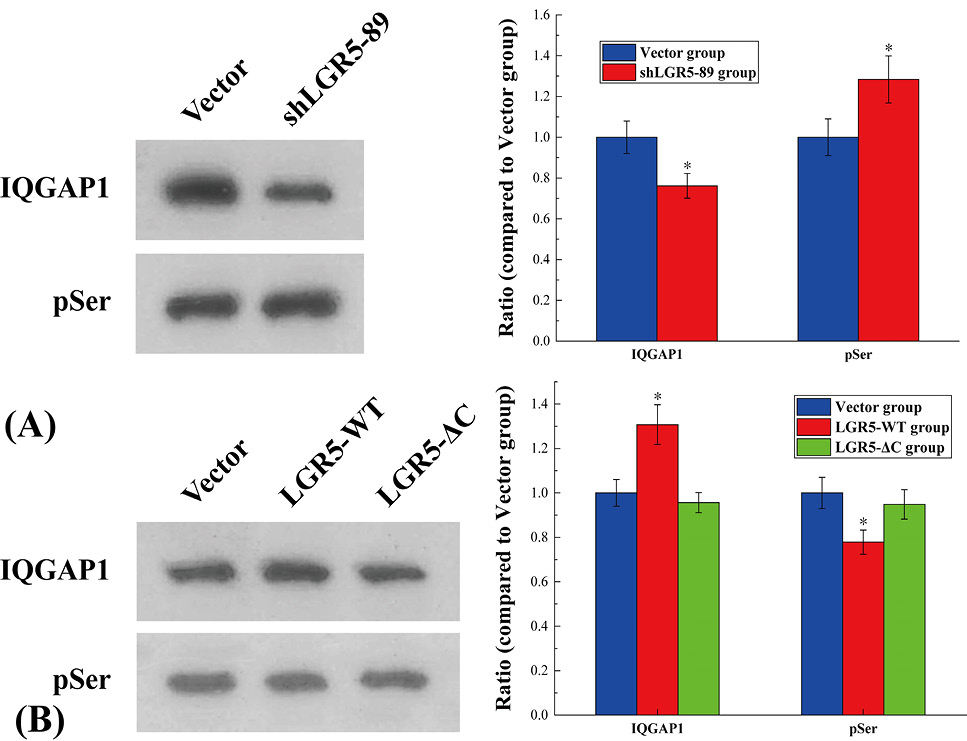
Fig. 3.
The results of immunoprecipitation to detect the reaction between LGR5 and IQGAP1. (A) Relative expression levels of IQGAP1 and phosphorylated IQGAP1 in LoVo cell lines and cell lines after LGR5 knockout. The symbol * means p < 0.05 compared to Vector group. (B) Relative expression of IQGAP1 and phosphorylated IQGAP1 in LoVo cell line, LGR5 overexpressing cell line and LGR5-ΔC (lack of C-terminal tail) overexpressing cell line. The symbol * means p < 0.05 compared to Vector group.