
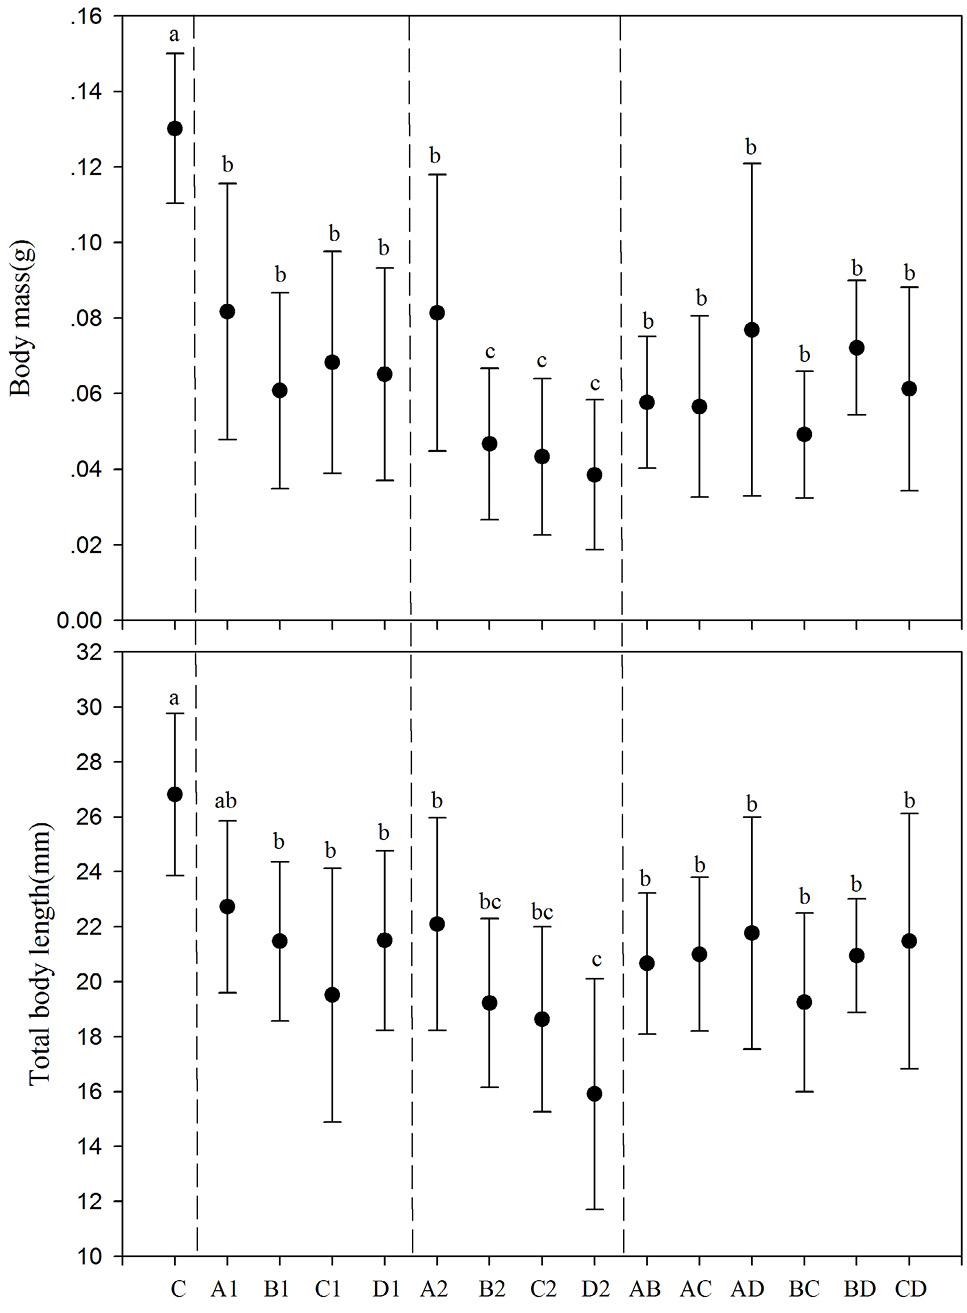
Fig. 2.
The growth of F. limnocharis tadpoles exposed to different concentrations of separate and combined pesticides compared with control group. Treatments are abbreviated as Figure 1. Types with different superscripts differ significantly (Tukey’s test, α = 0.05, a>b>c).