View larger version:
Download Original File
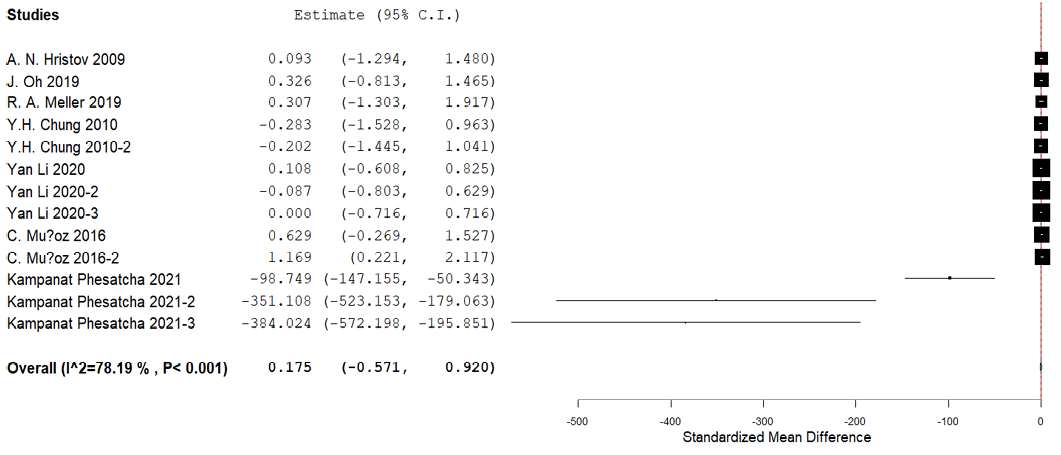
Figure 2:
The forest plot for Methane Emissions illustrating standardized mean differences, demonstrating overall impact with a 95% confidence range from -0.361 to 0.295.