View larger version:
Download Original File
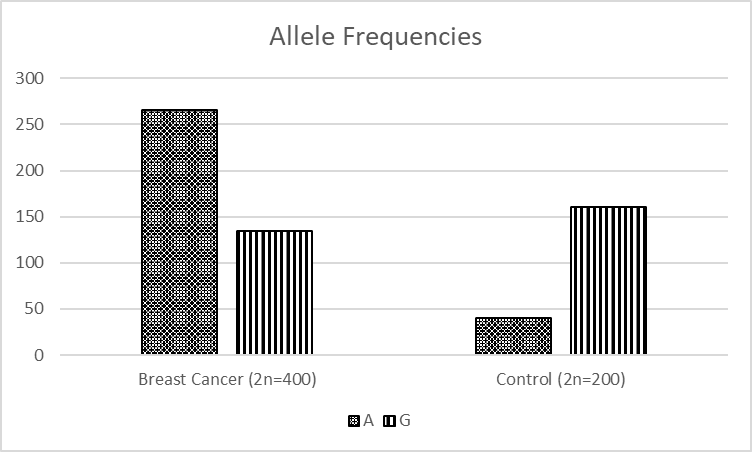
Fig. 2.
Comparison of Allele A and G in a study group
