
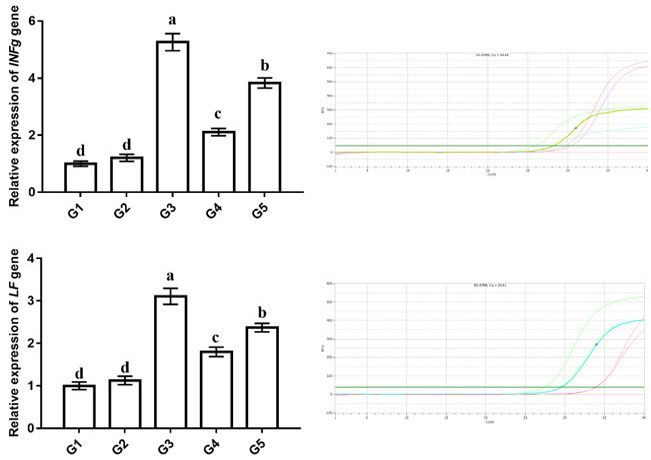
Fig. 1.
Effect of Sim on the expression of immunomodulatory INFγ and LF genes in the synovium of pristane-induced arthritic mice as detected by qPCR. Data were expressed as mean fold change ± SEM (n = 5) from the Cnt group (G1). Amplification curves showing the cycle threshold (Ct) values were displayed next to each gene. Columns with different letters (a-d) are significantly different at P<0.05. G1, Cnt; G2, Sim; G3, RA; G4, RA+Sim-co; G5, RA+Sim-post group.