
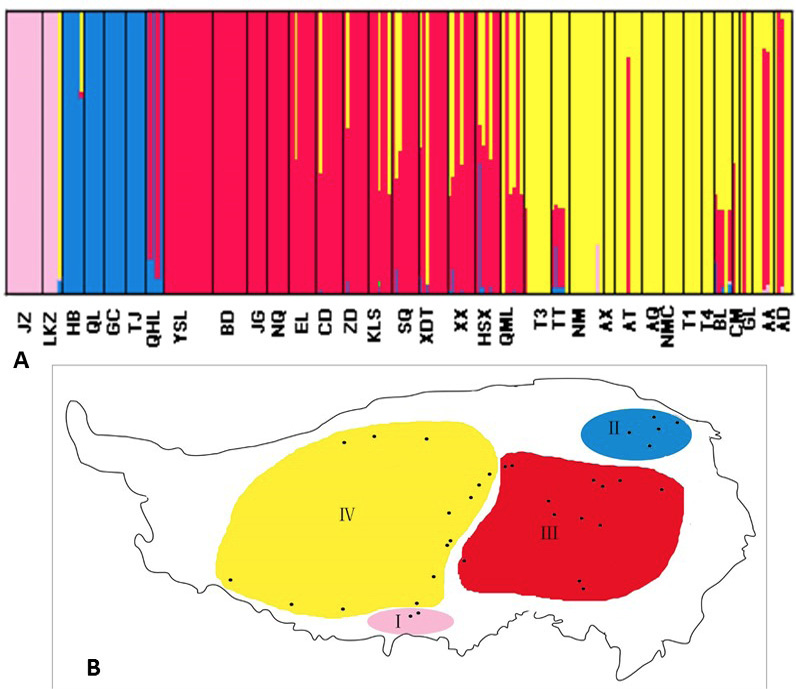
Fig. 3.
Bayesian clustering of plateau pika populations inferred with the program BAPS using mtDNA markers. (a) Admixture analysis for K=4. (b) Spatial clustering model for K=4. Populations with yellow, red, blue and green represent group I, II, III and IV respectively.