
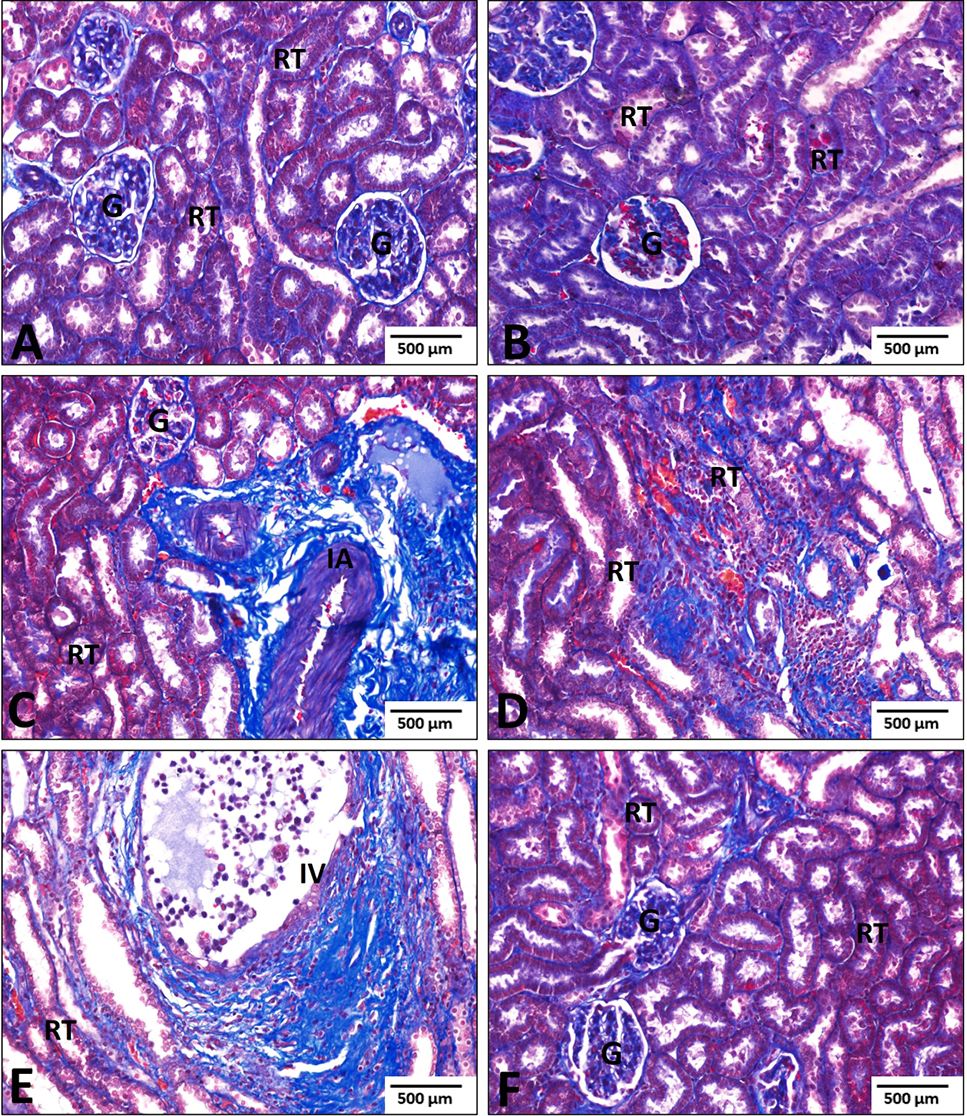
Fig. 3.
Images of Masson’s trichrome-stained sections of renal tissues from the CTR and experimental groups. A and B, the renal tissues of CTR and AME-treated rats showed a normal distribution of collagen (blue) in the glomeruli (G) and between renal tubules (RT). C-E, the renal tissue of EtOH-treated rats showed a high deposition of collagen fibers (blue) between the renal tubules and around the interlobular vein (IV) and artery (IA). F, the renal tissue of EtOH + AME-treated rats showed mild deposition of collagen fibers (blue) in the glomeruli (G) and between renal tubules (RT). Scale bar =500 µm; 200 ×.