View larger version:
Download Original File
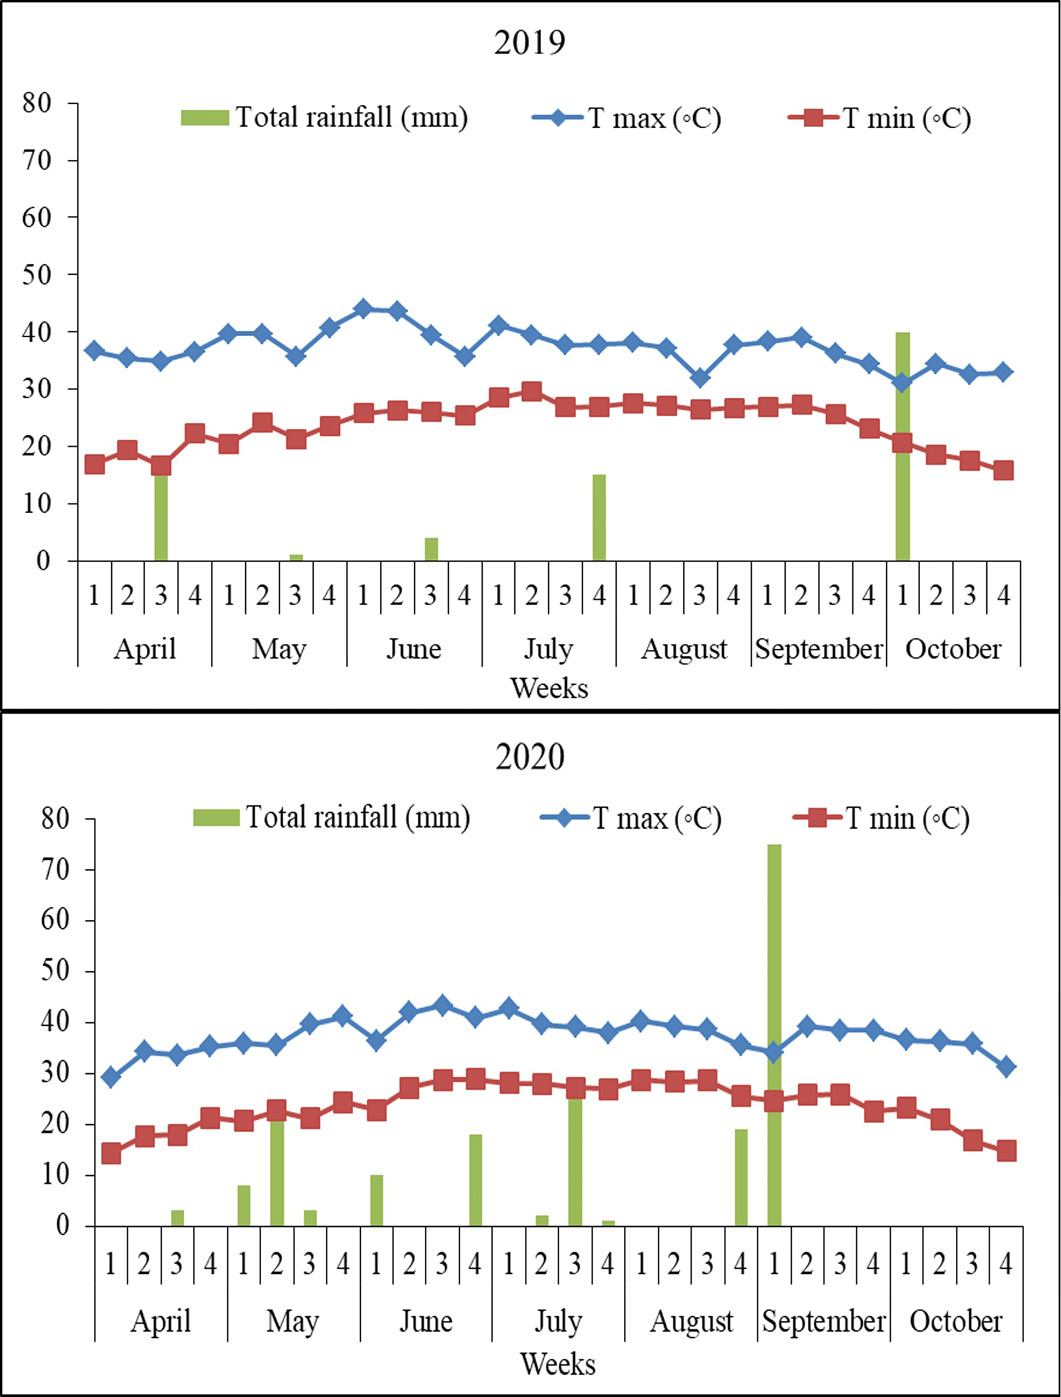
Figure 1:
Weather conditions of the experimental site during the course of study in years 2019 and 2020.
T max= Average maximum temperature; T min= Average minimum temperature