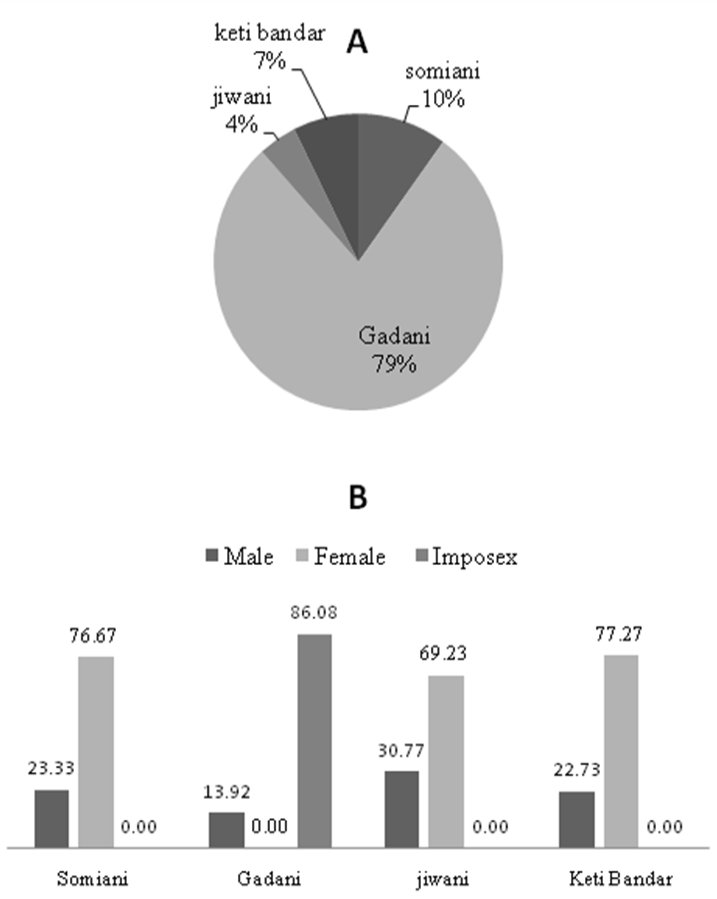
Figure 4:
A showing % total number of individual at all four sites and B showing % male, female and imposex at collection sites.
A showing % total number of individual at all four sites and B showing % male, female and imposex at collection sites.