
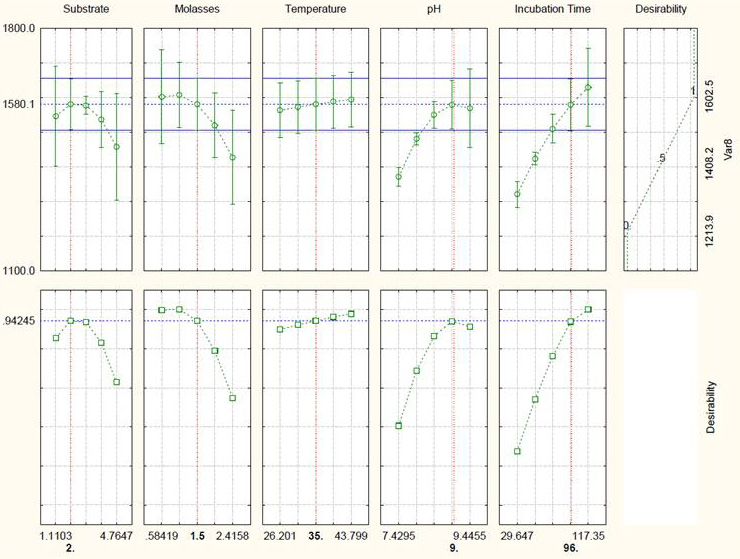
Figure 3:
Desirability chart representing the optimum levels for independent variables and predicted protease activity on them.
Desirability chart representing the optimum levels for independent variables and predicted protease activity on them.