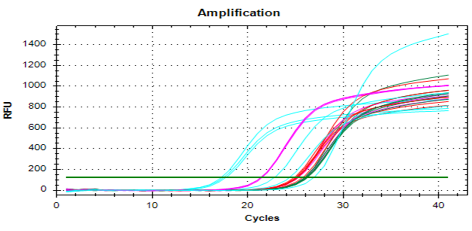
Figure 9:
The real time amplification plots of housekeeping (GAPDH) gene expression of ovarian tissue in rats experimental samples. the real time PCR polts of VEGFgene. The blue plots (control group), green plots (G1 group), red plots (G2group), purple plots (G3 group).