
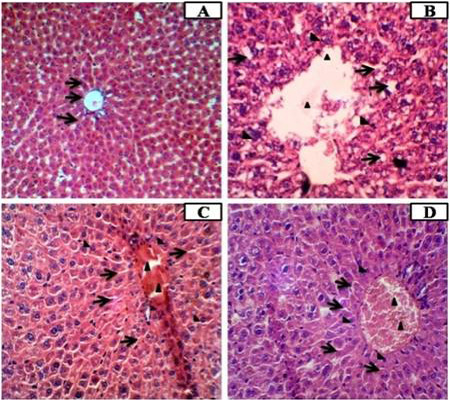
Figure 2:
Hematoxylin-eosin staining (H and E X 100 and 400) of liver sections of diabetic 2(B), high dose 1(C) and medium dose of A. barbadensis 1(D) treated mice, 14 days treated compared with control 2(A). Arrows indicating cell vacuolations.