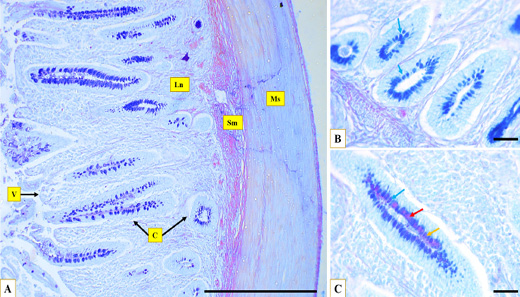
Figure 4:
Microphotographs show the glycoprotein distribution through the caecum, the muscular layer (Ms), the submucosa (Sm), caecal crypts (C), caecal villi (V), the lymph nodules (Ln) at proximal portion (A), at the basal crypt (B), and at the longitudinal crypt (C), acidic reaction (blue arrow) neutral reaction (red arrow), and mixed reaction (yellow arrow), AB/PAS stain, (A) Scale bar=200 µm, (B)(C) Scale bar=20 µm.