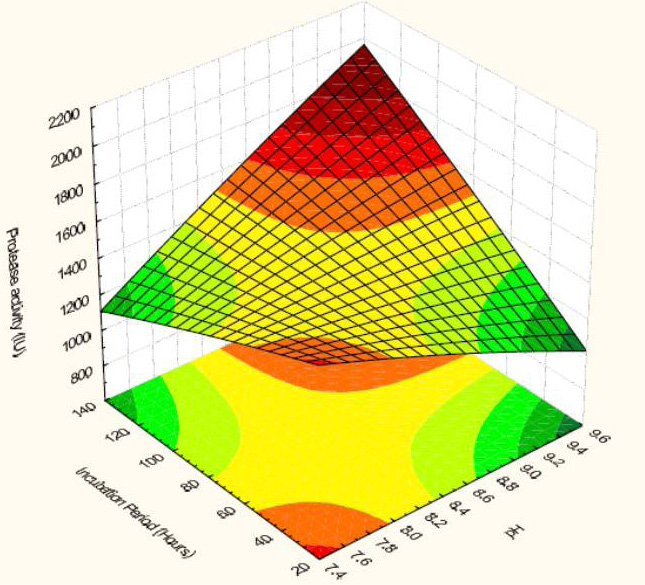
Surface plot representing the interaction effect o of incubation period and pH on protease production.