View larger version:
Download Original File
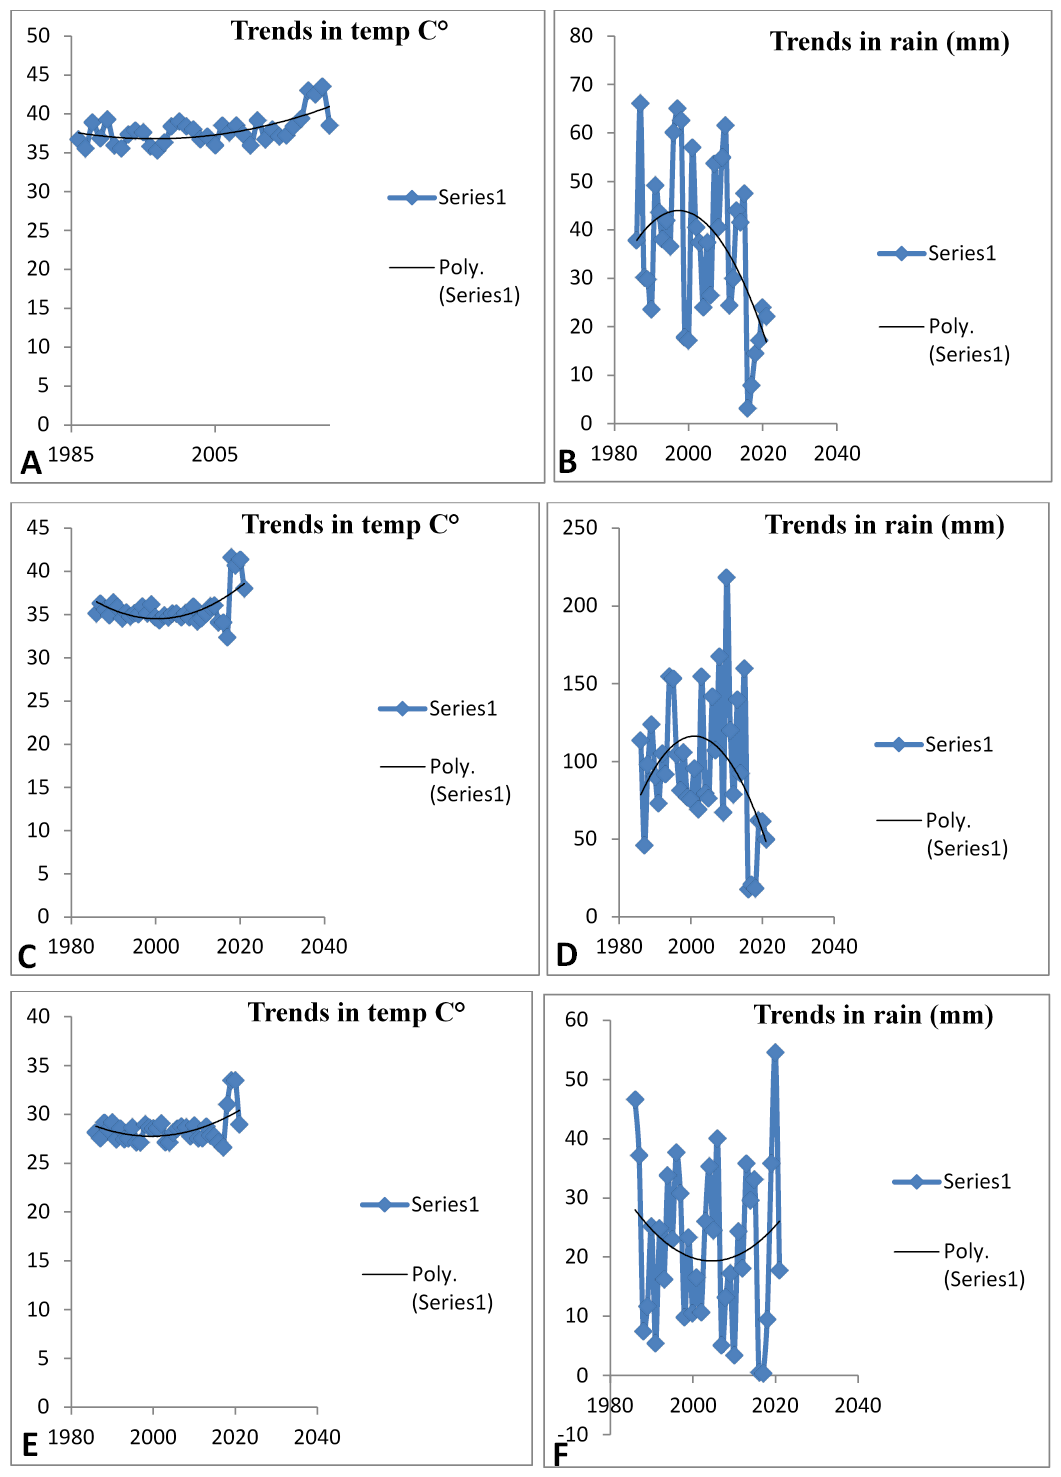
Figure 3:
Trend graph in central zone at sowing stage (A, B), vegetative stage (C, D), harvesting stage (E, F).
Source: Government of Khyber Pakhtunkhwa year wise data.
