View larger version:
Download Original File
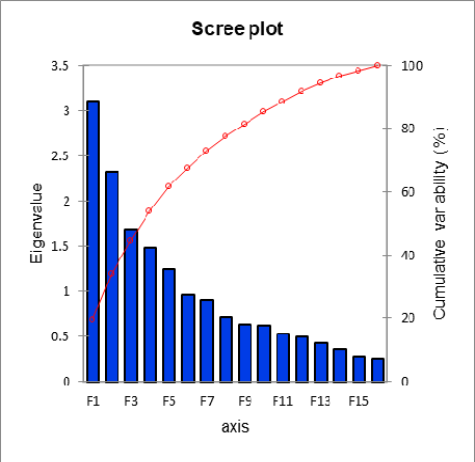
Figure 6:
Scree plot for the diverse rice genotypes for variability contribution.