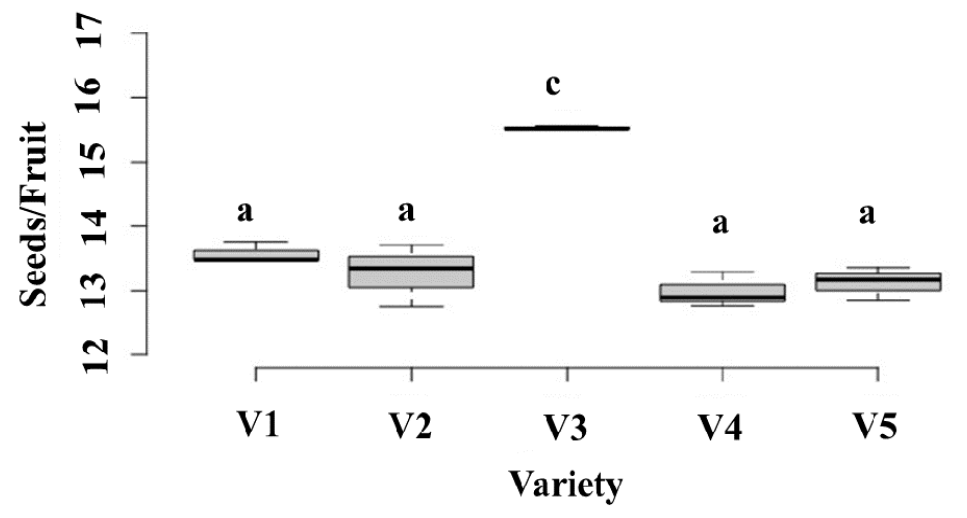
Figure 4:
Seeds per fruit in different varieties V1 (Saba), V2 (Lalbeni), V3 (White Beauty), V4 (Toki) and V5 (1070). Boxes: the interquartile range. Lines across the boxes: the average of the values. The line above and below the vertical dashed lines: the maximum and minimum values. The letters a, b, c, . . . indicate significant differences between boxes.