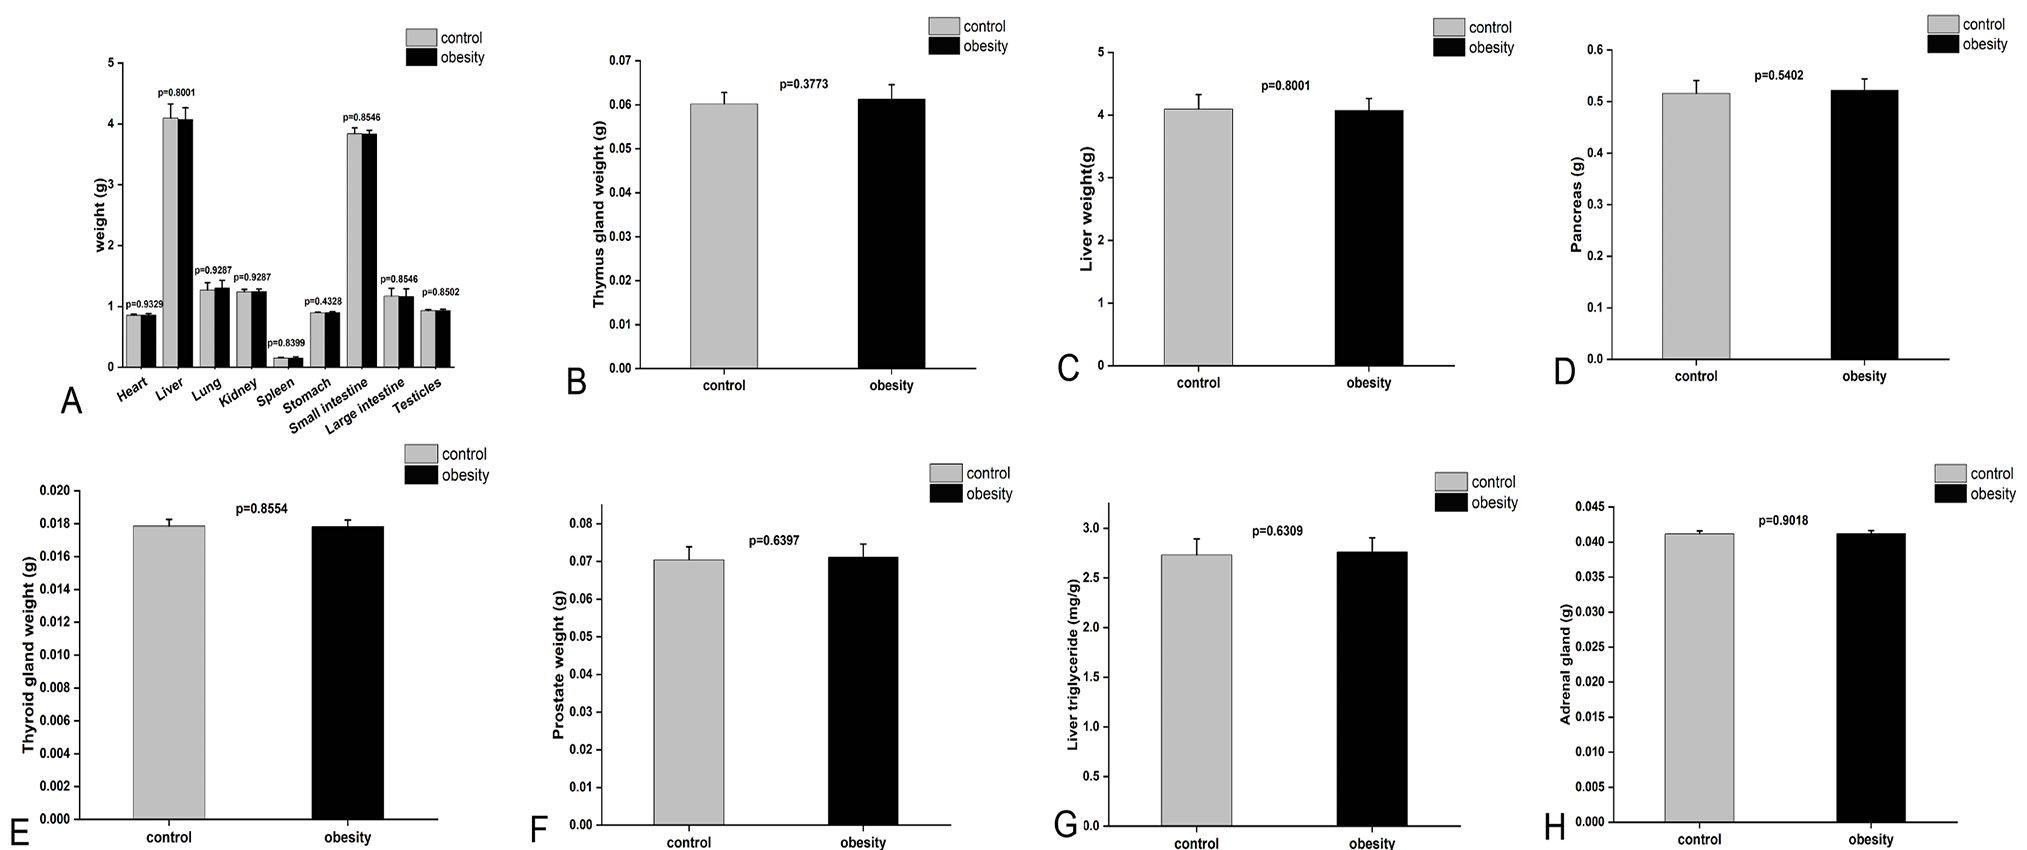
Fig. 4.
A, Weight of heart, liver, lung, kidney, spleen, stomach, small intestine, large intestine, testis in control and obesity group. B, Weight of thymus gland in control and obesity group. C, Liver weight of control and obesity group T. belangeri, Vertical axis shows mass in grams for BW. D, Weight of pancreas in control and obesity group. E, Weight of thyroid gland in control and obesity group. F, Weight of prostate in control and obesity group. G, Liver triglyceride content in control and obesity group T. belangeri. H, Weight of adrenal gland in control and obesity group. Data are presented as mean ± SEM; N= 14 per group except H; statistical significance is indicated: *P < 0.05, **P < 0.01.