
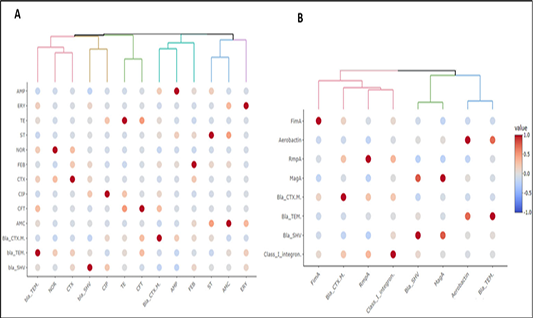
Figure 3:
Heatmap showing the correlation coefficient (R) between pairs of (A) antimicrobial resistance phenotypes and antimicrobial resistance genes and (B) antimicrobial resistance genes and virulence genes. The color denotes R value as indicated on the side color scale. The upper dendrogram illustrate the clustering pattern of feature’s correlation according to their R value. Each colored branch of dendrogram represents a single cluster.