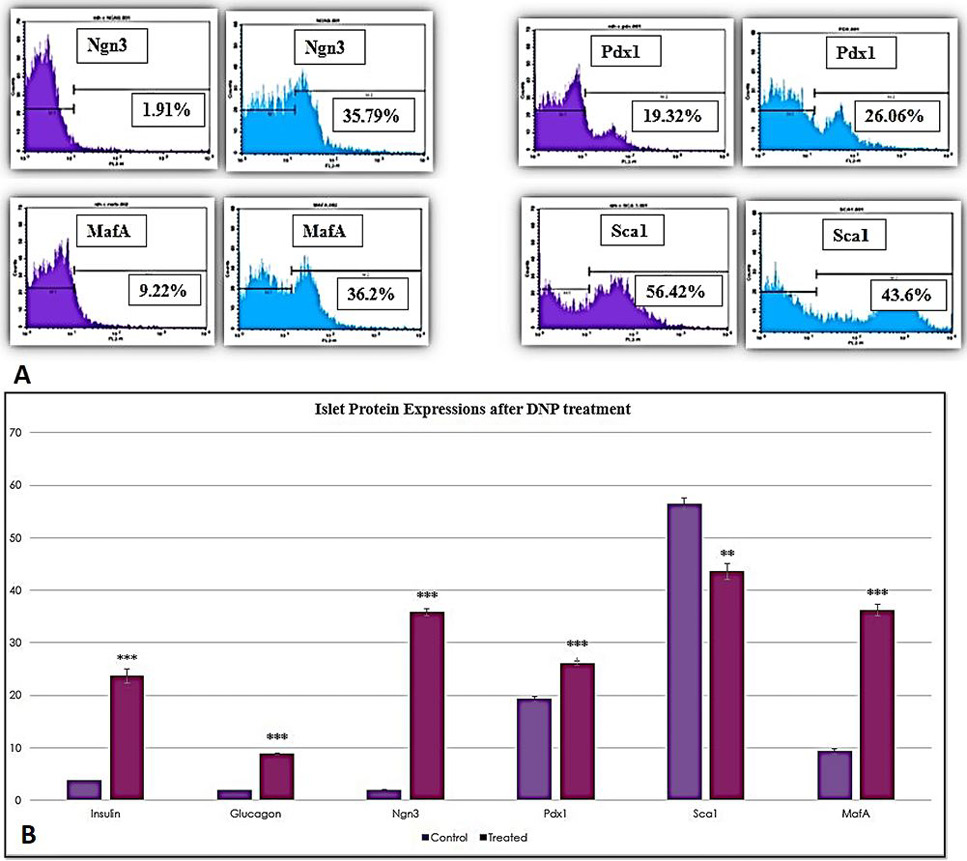
Fig. 3.
Flow cytometric analysis of pancreatic proteins in NIH3T3 cells after DNP treatment: pancreatic proteins, MafA, Pdx1, insulin, glucagon, Ngn3 and Sca1 were analyzed in NIH3T3 cells before and after treatment with DNP. Cells labelled with Alexa fluor 546 goat anti-mouse or anti-rabbit secondary antibodies were used as controls (Fig. 3A). Number of positive cells are shown as percentage of untreated cells. Significant increase (p<0.001) in insulin, glucagon, MafA, Ngn3 and Pdx1 expressions was observed after DNP treatment (Fig. 3B). Data is presented as mean ± S.E.M.; level of significance is p < 0.05; where *** = p < 0.001, ** = p < 0.01, and * = p < 0.05.