View larger version:
Download Original File
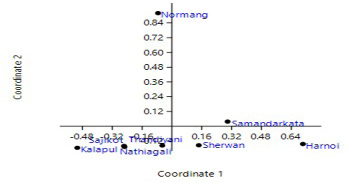
Figure 6:
PCoA graph showed the Coordination among environmental variables based on morphometric data.