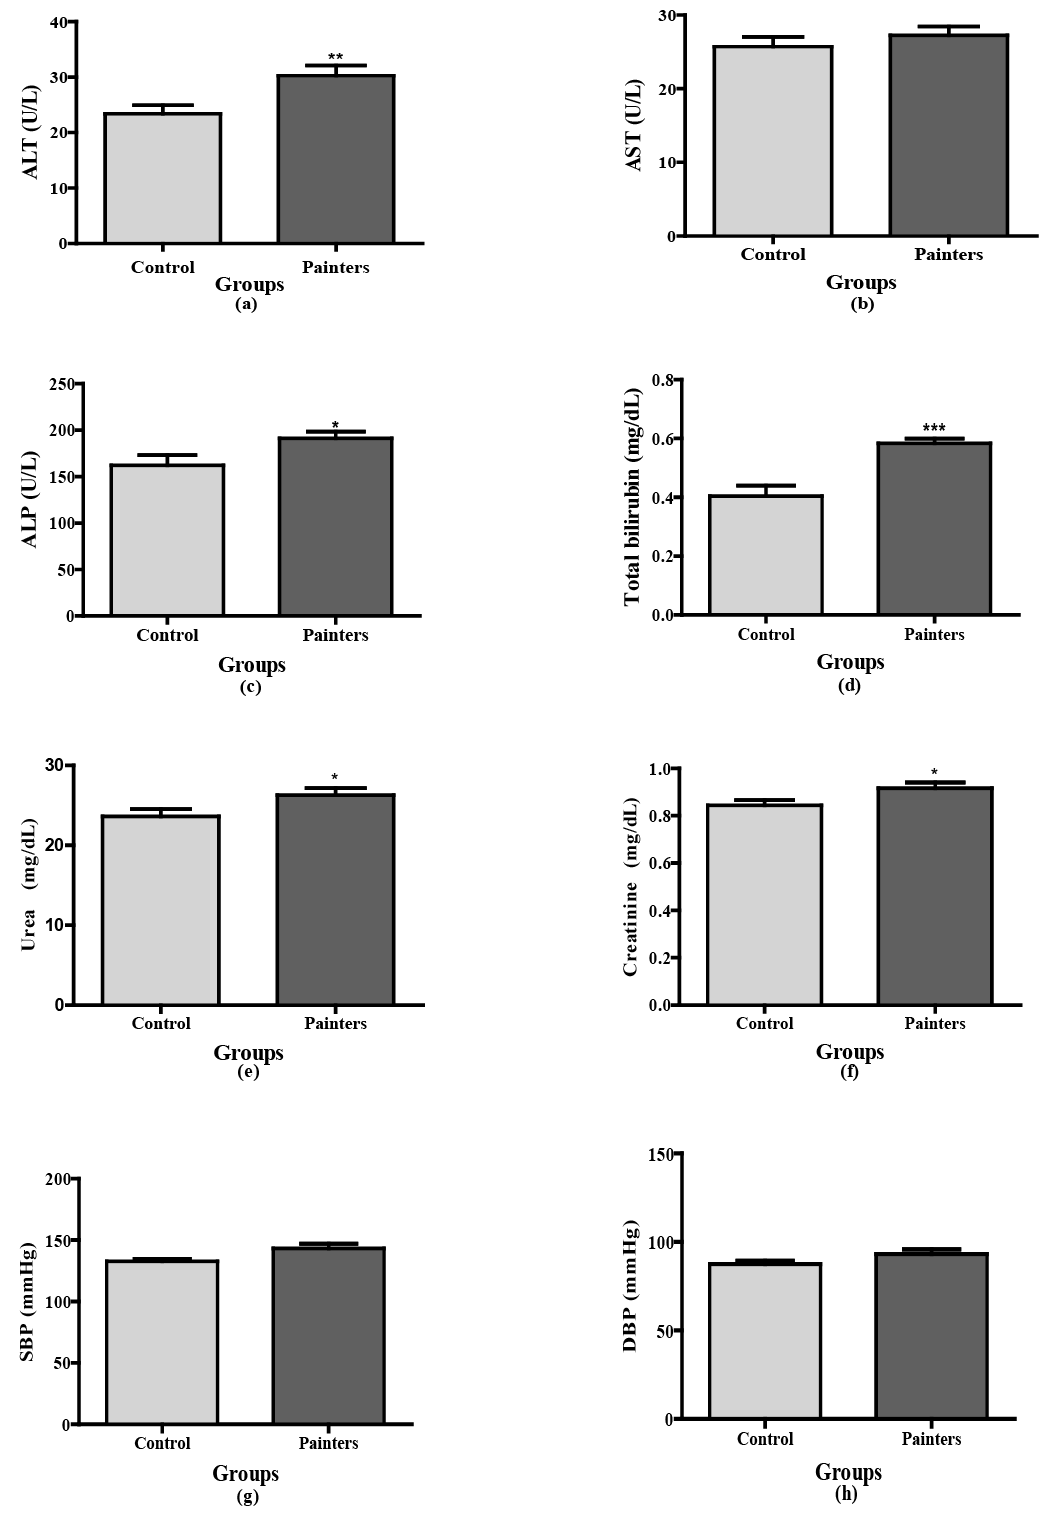
Figure 1:
(a-h) Comparison of parameters in comparable groups. Values are Mean ± SEM. *, **, *** indicate significance at P < 0.05, 0.01, 0.001, respectively.
(a-h) Comparison of parameters in comparable groups. Values are Mean ± SEM. *, **, *** indicate significance at P < 0.05, 0.01, 0.001, respectively.