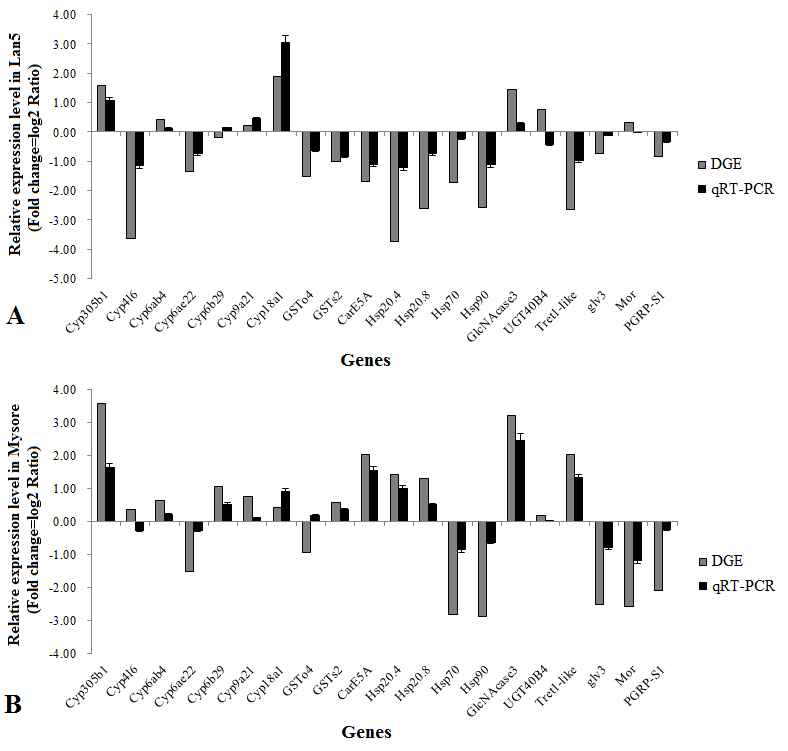
Fig. 4.
Verification of transcriptomics results of DEGs by qPCR. (A) Lan5; (B) Mysore. The y-axis indicates the relative expression level of gene mRNA transcripts (fold change=log2 ratio). The x-axis indicates the selected genes. Vertical bars represent the mean±SE (n=3).