View larger version:
Download Original File
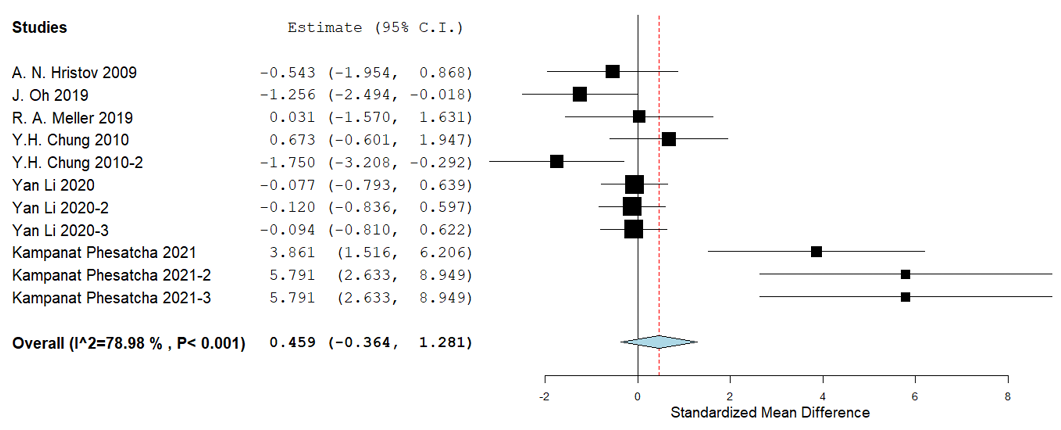
Figure 4:
The forest plot for pH illustrating standardized mean differences.