
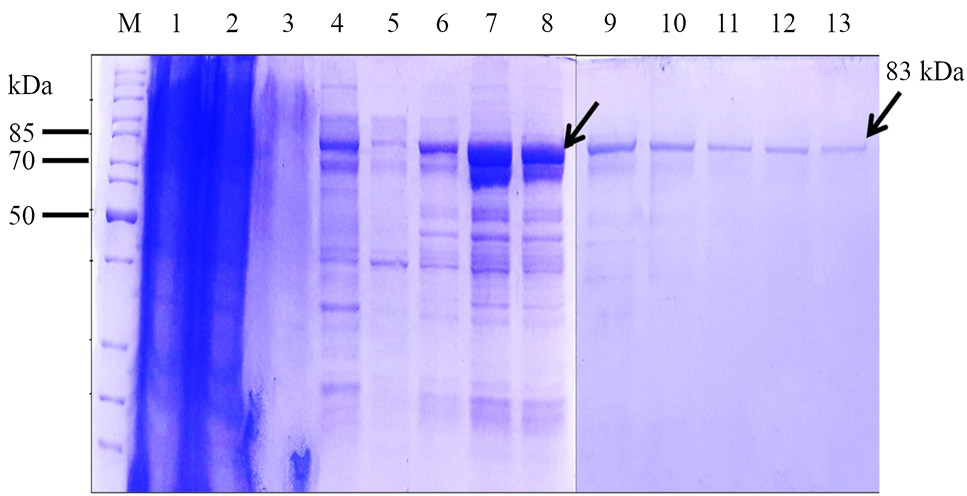
Fig. 4.
Analysis of the recombinant M protein purified by affinity chromatography using nickel-nitrilotriacetate (Ni-NTA) columns. Samples collected at different stages of affinity chromatography were analyzed through SDS-PAGE. Lane 1 represents the whole cell lysate, lane 2 depicts the soluble fraction, lane 3 denotes the insoluble fraction, lane 4 represents the flow-through from the column, lane 5 shows the fraction collected during stringent washing of the column, lanes 6 to 13 represent elution fractions. Arrows indicate the band corresponding to the target (His8-MBP-Matrix) protein (~ 83 kDa). Lane M depicts the mobility of a protein molecular weight marker for estimating the size of separated proteins.