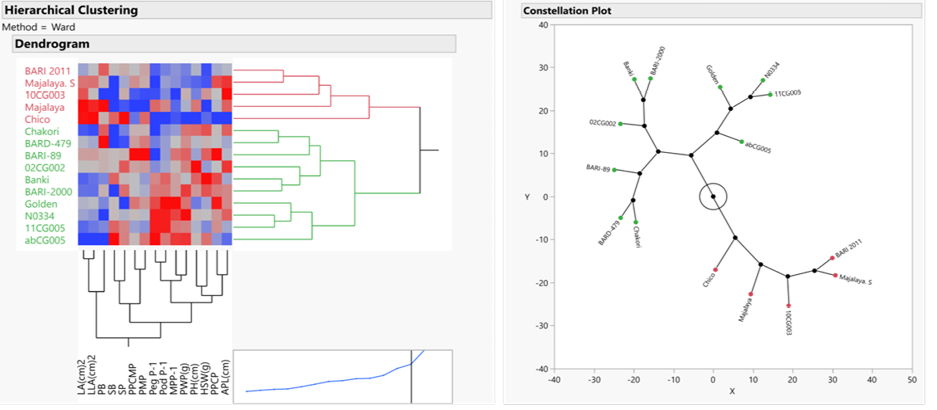
Figure 2:
Cluster analysis indicates the degree of genetic diversity. Cluster diagram using WARD’s method revealed three clusters. Cluster I comprise of five genotypes, cluster II contains six genotypes and cluster III contains four genotypes.
