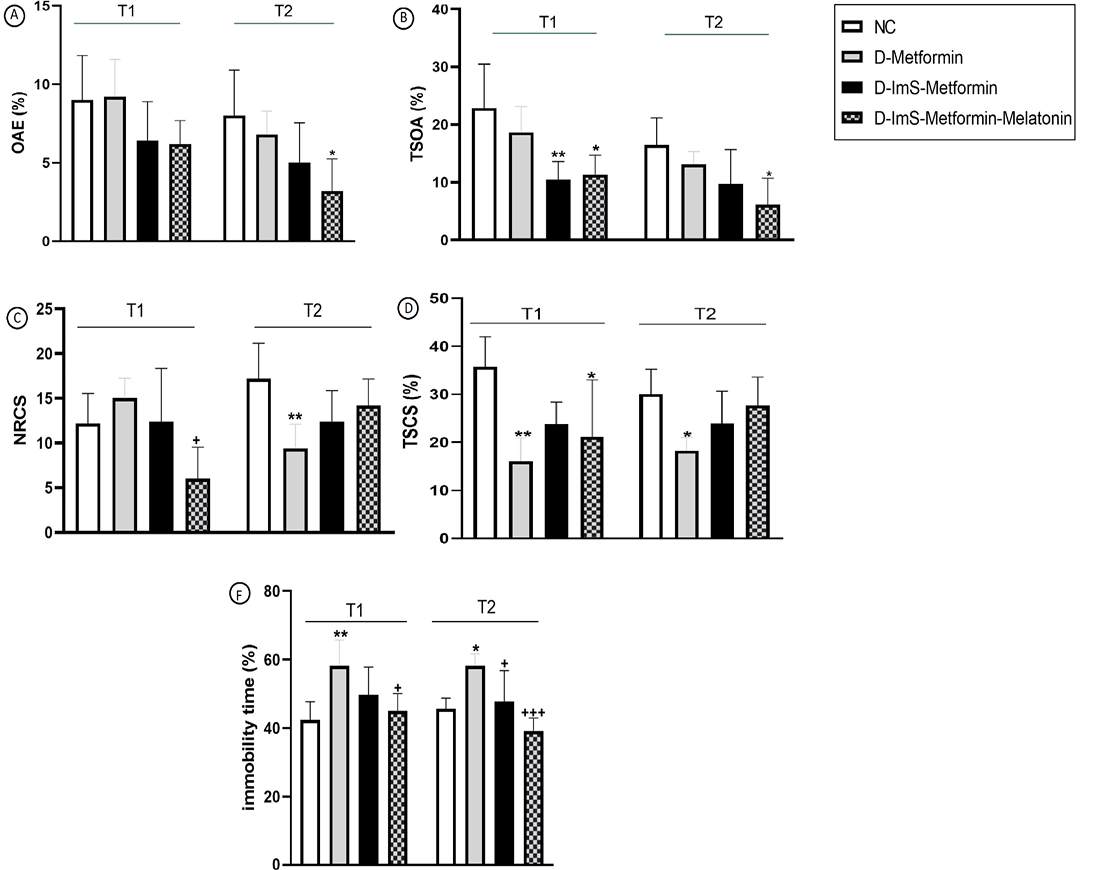
Figure 3:
Effects of MET and MEL phenolic in STZ diabetic mice exposed or not to immobility stress on anxiety and depressive-like behavior. Data are expressed to mean ± SDSD (n=7). *p<0.05, **p<0.001; ***p<0.01 versus NC group. + p<0.05 ++p<0.01 versus D-Met. @ p<0.05 @@ p<0.01 @@@ p<0.001 versus D-Ims-Met; T1: after 1 month of treatment; T2: after 2 months of treatment.*