Fig. 5.
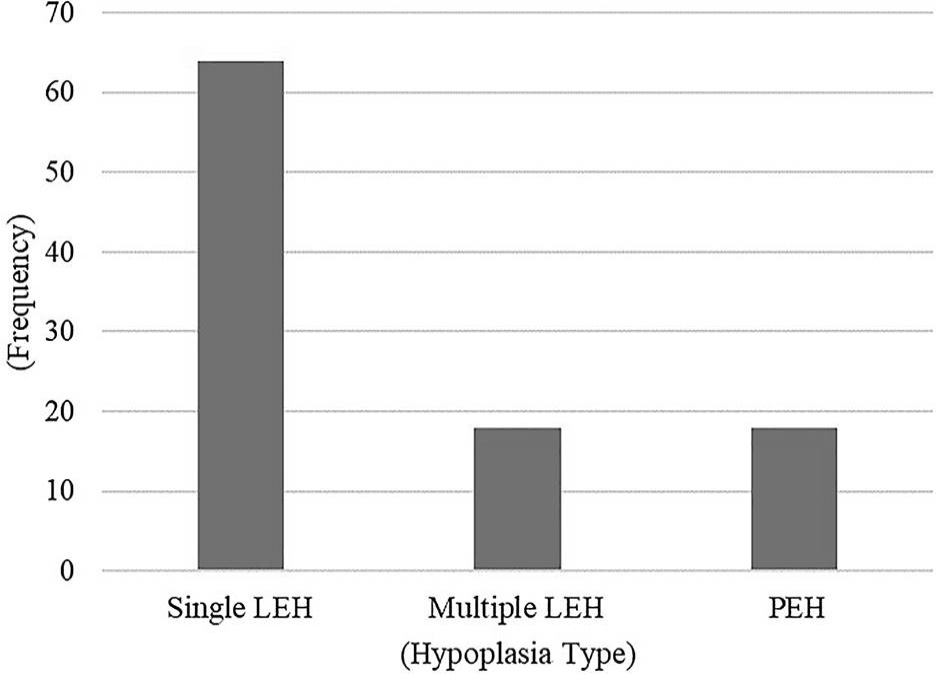
Histogram showing frequencies (%) of hypoplasia types (single LEH, multiple LEH and PEH) in the observed teeth samples.
Histogram showing frequencies (%) of hypoplasia types (single LEH, multiple LEH and PEH) in the observed teeth samples.