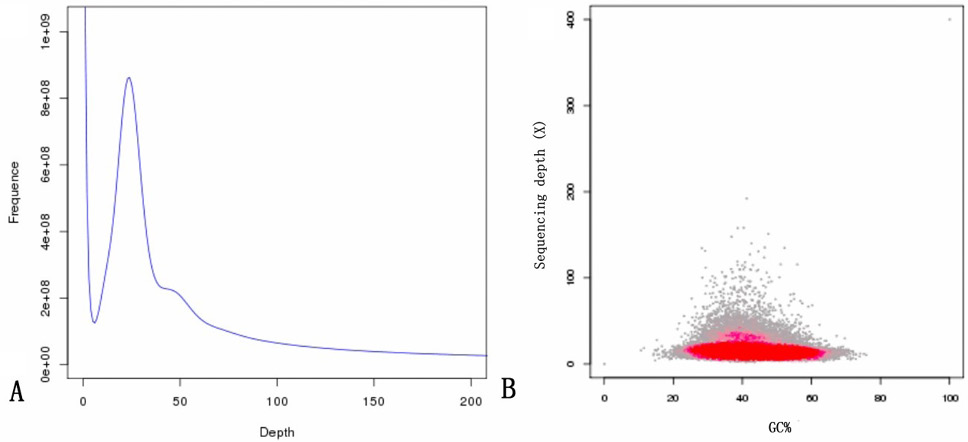
Fig. 1.
Results of a genomic survey using Illumina sequencing. (A), A K-mer (K=17) analysis to estimate the genome size of Procambarus clarkii. The x-axis is the depth (X); the Y-axis is the proportion that represents the frequency at that depth divided by the total frequency of all depths. (B), GC content and average sequencing depth. The X-axis represents the GC content, and the Y-axis represents the average depth. The red region represents the relatively dense part of the points in the scatter plot.