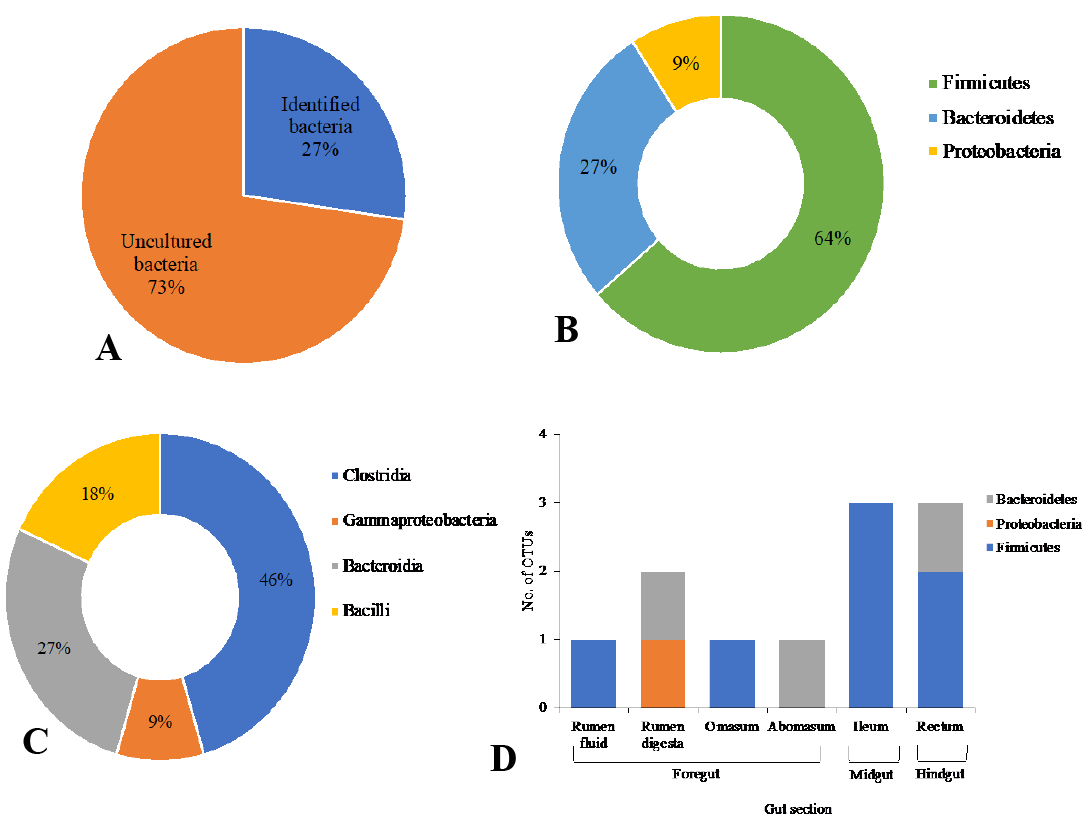
Figure 4:
Distribution of 16S rRNA sequences from the GIT of riverine buffalo (Buffalo 1); Percentage of identified and uncultured bacteria (A); Percentage of the total relative abundances of phyla; Percentage of relative abundances of class (C) and relative abundances in phyla at the different locations in the GIT (D).