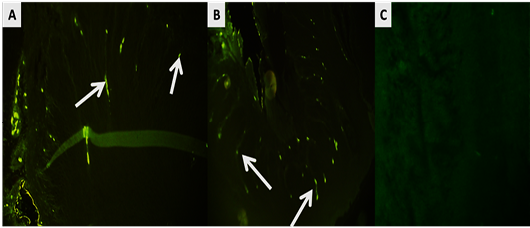
Figure 8:
Immunohistochemical image of the esophagus in (A: turkey; B: ostrich, C: negative control) show immunoreactive cells (white arrows) (lable by FITC with the secondary antibody) in the mucosal layer that expression of serotonin cells. And negative control (C) when the omitted of primary antibody and used secondary antibody. (A and B: X200; C: X400).