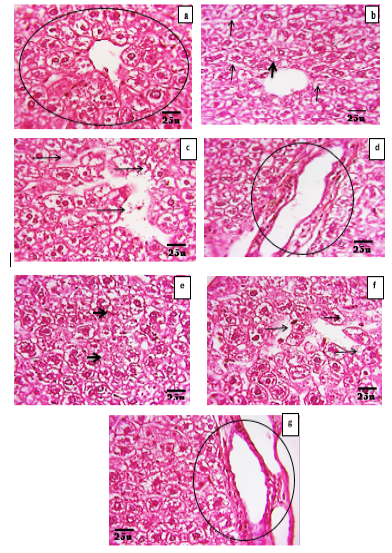
Figure 3
(a): Photomicrograph of a liver from the control group represents normal architecture (circle). (e, f): A section of the liver from group III on day 30 showing semi-normal architecture, except for slight expansion of the hepatocytes sinusoids (arrow) and cytoplasmic degeneration (thick arrow). (c, d): section of liver from group II at day 30 showing acute hepatocyte necrosis (arrow), cytoplasmic degeneration (thick arrow), expansion, and necrosis of blood vessels (circle). (g): A section of the liver from group IV on day 30 showing a limited extent of hepatocyte necrosis (arrow), and cytoplasmic degeneration (thick arrow), which also showed limited expansion and degeneration of blood vessel walls (circle). H and E. X400, (Scale bar 25u).