View larger version:
Download Original File
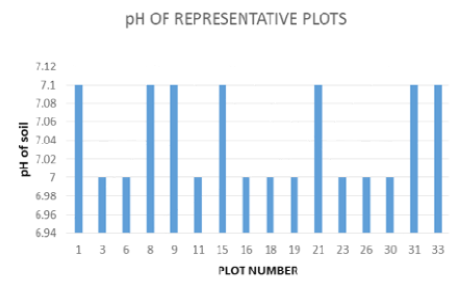
Figure 4:
pH of representative plots.