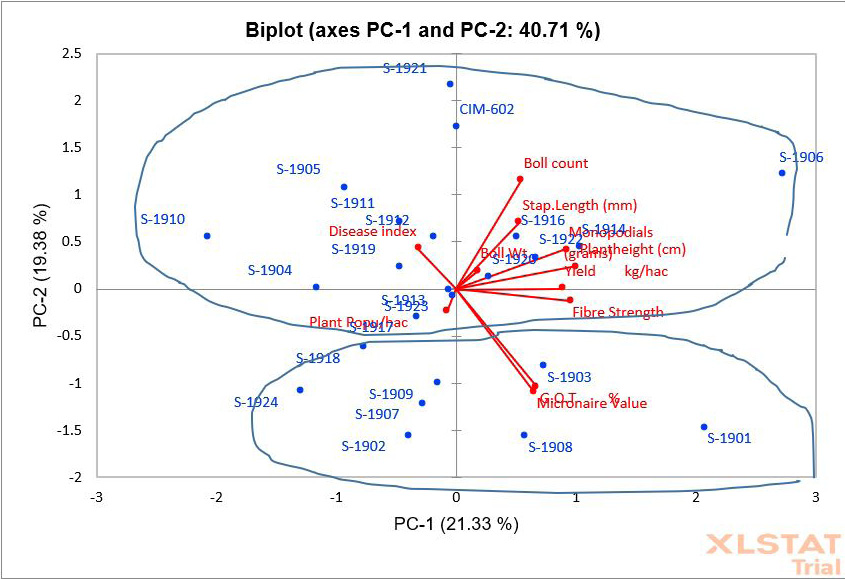
Figure 1:
Biplot indicating scatter pattern of cotton strains along with contribution of various traits in total divergence (PC-1 x PC-2).
Biplot indicating scatter pattern of cotton strains along with contribution of various traits in total divergence (PC-1 x PC-2).