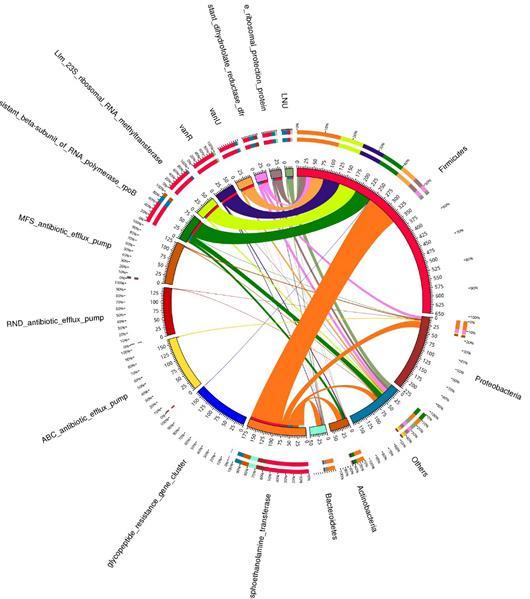
Figure 5:
A circular diagram shows antibiotic resistance genes and metabolic processes at the bacterial phylum level in different sample of fecal gut microbiota of dairy cows. The left side focuses on metabolic activities while the right side of the representation highlights bacterial phyla. The widths of the inner and outer circles signify relative abundances, where inner circle colors indicate cumulative abundances by bacterial phylum at right and metabolic process at left side. Outer circle colors represent the relative abundances of processes of bacterial phylum at right side and metabolic process phyla at left side.