View larger version:
Download Original File
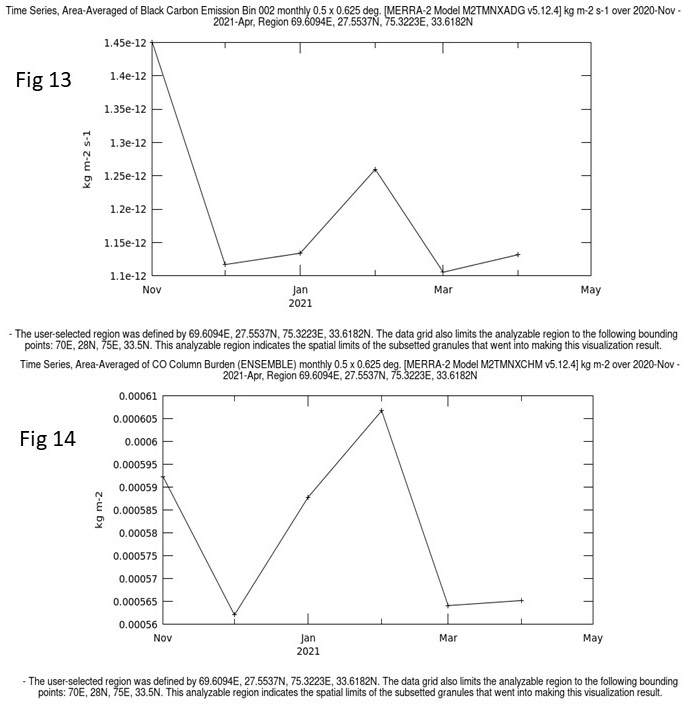
Figure 13: Variation in BC values throughout WGP.
Figure 14: Variation in CO values throughout WGP.