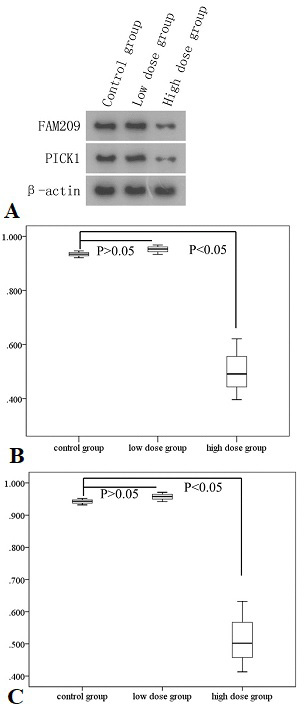
Fig. 1.
The level of FAM209, PICK1 protein in the testis tissue by western blotting. A shows protein bands of FAM209, PICK1. B and C show the level of FAM209 and PICK1 protein, respectively. Compared to FAM209 protein value (0.942±0.010) in control group, FAM209 protein value (0.957±0.014) in low dose group had no significant difference, but FAM209 protein value (0.516±0.110) in high dose group is significantly decreased. PICK1 protein value in three groups is consistent with FAM209 protein value in three groups.