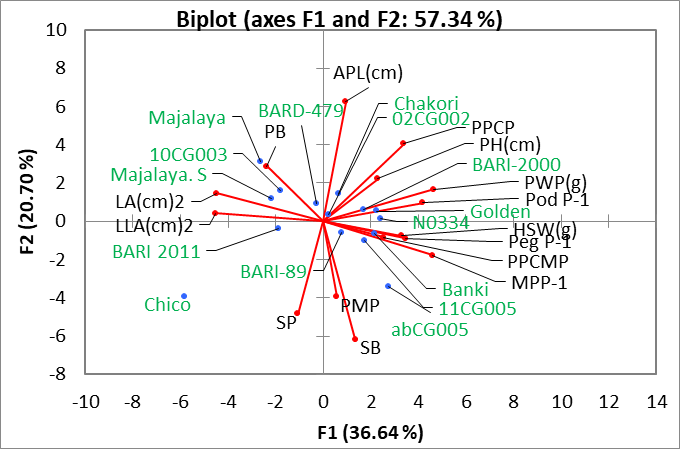
Figure1:
Biplot (Principal component analysis) indicating overall variability in 15 genotypes for traits variables, LA (Leaf Area), LLA (Leaflet Area), PB (Primary Branches), SB (Secondary Branches), PH (Plant Height), PPCP (Percentage of Pegs Converted into Pods), MPP-1 (Mature Pods per Plant), PPCMP (Percentage of Pegs Converted into Mature Pods), PMP (Percentage of Mature Pods), PWP (Pods Weight per Plant), SP (Shelling Percentage), APL (Average Pod Length) and HSW (Hundred Seed Weight).
